Figures & data
Table 1. The list of collected samples of in vivo aged restorations.
Figure 1. SEM image revealing the formation of crystals inside a pore observed in freshly made zinc phosphate cement.
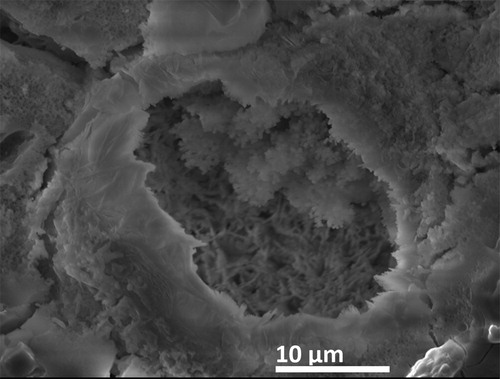
Figure 2. SEM images revealing the formation of large crystals inside the pores in a zinc phosphate cement after 6 years in vivo aging, sample a (a), the pores on the surface of the cement after 25 years in vivo aging, sample b, exposed to oral environment that are covered with body tissues appeared dark colour in the BS mode (b), and the crystal growth in a calcium phosphate cement after 25 years in vivo aging in contacting with gingiva, sample b (d).
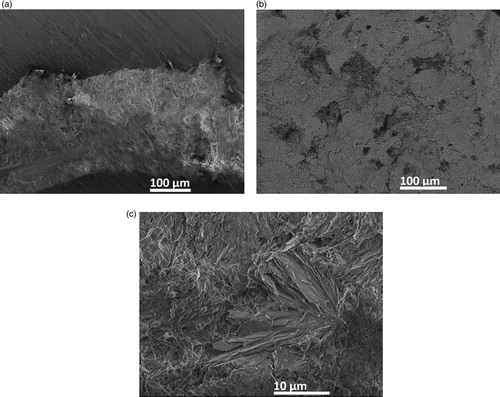
Figure 3. XRD patterns taken on the horizontally cut surface of a zinc phosphate cement in vivo aged for 6 years (sample a) (a), and on two calcium phosphate cement samples in vivo aged for 25 years (sample b) and 21 years (sample d), respectively (b).
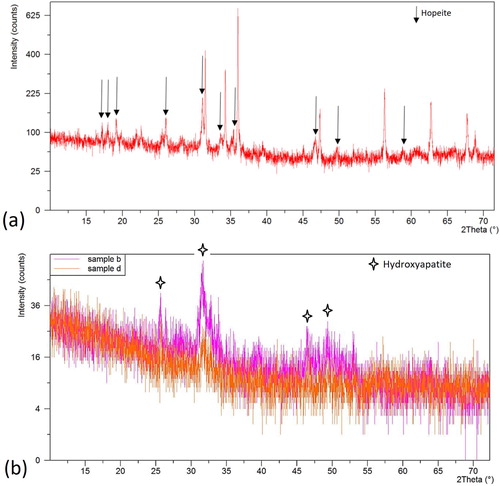
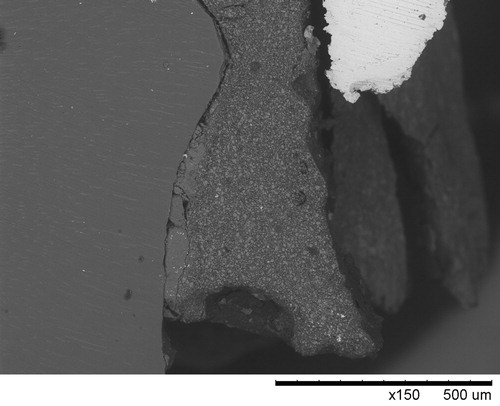
Figure 4. SEM images taken on a vertically cross-sectioned zinc phosphate cement sample in vivo aged for 6 years (sample a) revealing cracking and loss of cement at the margin end. Insets are images taken with higher magnification at the spots indicated by the circles.
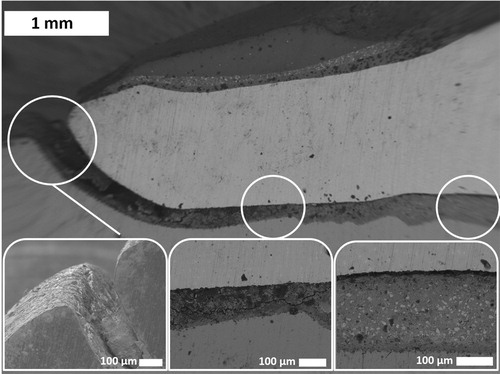
Figure 5. EDS analysis at the margin end of a zinc phosphate cement samples in vivo aged for 9 years (sample c), indicating the change of zinc and carbon content. The inserts show the EDX results for indicated area on the cement.
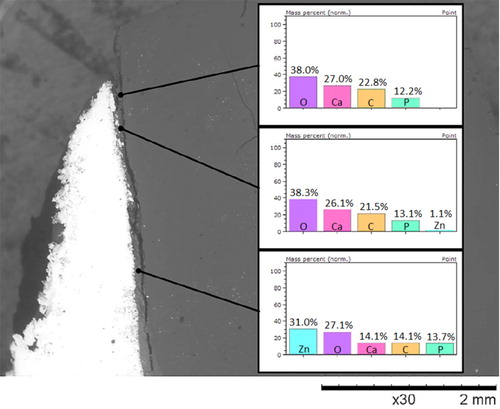
Figure 6. Normalised Raman shifts recorded in freshly made zinc phosphate cement and the one after 25 years in vivo aging, sample b.
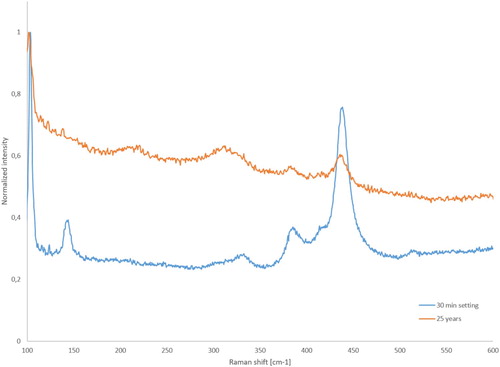
Figure 7. SEM images taken on the vertically cross-sectioned samples revealing the interfacial debonding taking place on the interface between the zinc phosphate and tooth observed in sample c (a), respectively, on the interface between the resin cement and crown that is turn to the interface between zinc phosphate cement and tooth when zinc phosphate cement is used for lining (upper right corner), sample e (b).
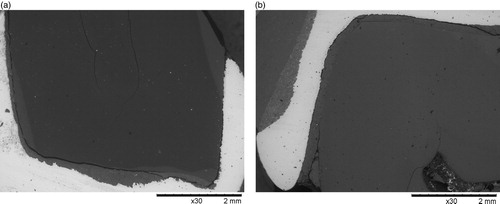
Figure 8. An SEM image revealing the filling of the marginal gap by biological masses in sample a after 6 years in vivo aging when a zinc phosphate cement was used.
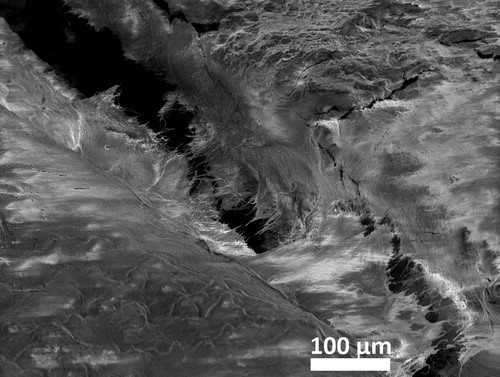
Figure 9. The SEM/EDS mapping images taken on the sample e after 6 years in vivo aging when resin composite cement and zinc phosphate cement were used for lining and for luting, respectively. The strong element contrast of aluminium and zinc detected in different regions confirmed the use of a zinc phosphate cement and a resin composite cement containing alumina and silica fillers. The detected carbon content inside the zinc phosphate cement indicated the contamination of the zinc phosphate cement by saliva/ oral fluid via the formed interfacial gap.
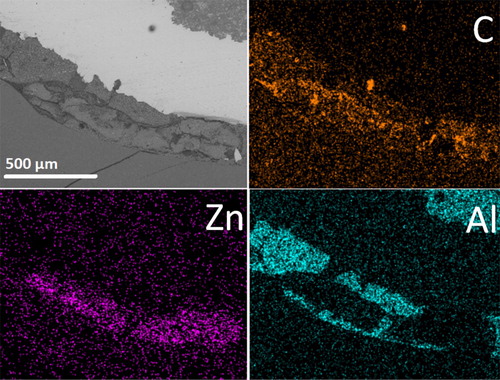
Figure 10. SEM image of the cross section of sample e, revealing the restoration (bright)-cement-tooth (dark) interfaces and the presence of excess cement on the tooth surface outside the marginal end.