Figures & data
Figure 1. Conceptual model.
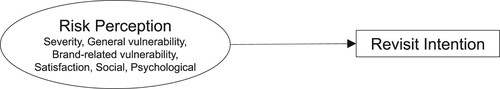
Figure 2. Loevestein Castle (picture by Pieter de Rooij).
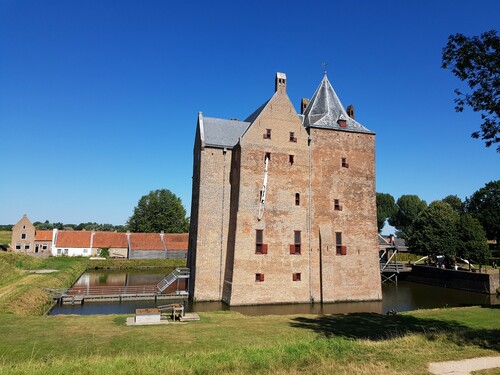
Figure 3. Loevestein Castle COVID-19 rules (picture by Pieter de Rooij).
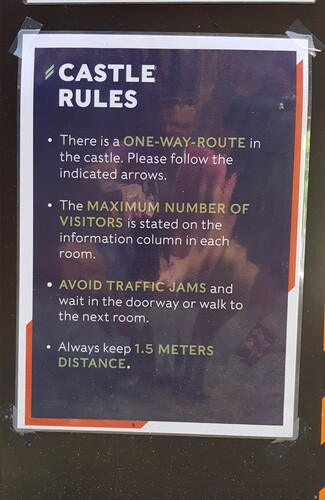
Table 1. Demographic profile of the respondents (N = 470).
Table 2. Means and standard deviations of risk perceptions (RP) and revisit intention.
Table 3. Exploratory factor analysis risk perception dimensions.
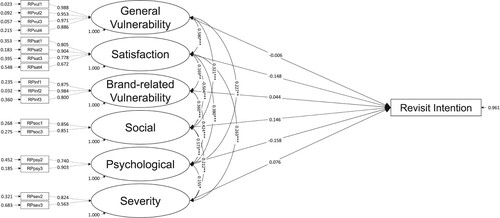
Figure 4. Multivariate Structural Model with standardized regression coefficients. Striped lines represent the factor loadings. Regular lines depict the bivariate structural model. Non-significant correlations between risk perception dimensions have been omitted. *p < .05. **p < .01. ***p < .001.