


Figures & data
Figure 1. Heritability monozygotic (MZ) versus dizygotic (DZ) twins.
The DNA helix visualizes the additive genetic (A) and non-additive genetic (D) effects. The correlation between MZ twins is assumed to be 1 for the A as well as the D component. Contrastingly, the correlation between DZ twins is assumed to be 0.5 for the A component and 0.25 for the D component. Next, the plant icon visualizes the unique, non-shared environment (i.e. the E component). Lastly, that 100% of the shared environment (C) is similar in MZ as well as DZ twin pairs is resembled by the house in this figure. Remember, only an ADE or ACE model gets fit, depending on the twin correlations.
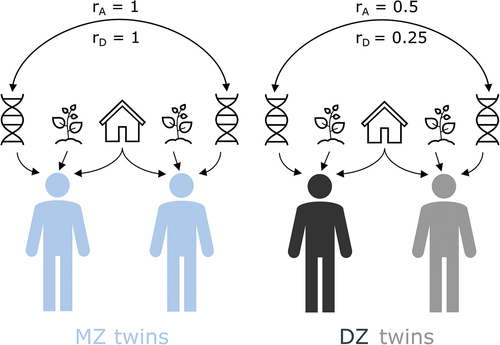
Figure 2. Phenotypic correlation: PI-18 primals and personality traits.
While the shade of greenness represents stronger positive correlations, the shade of pinkness represents stronger negative correlations.
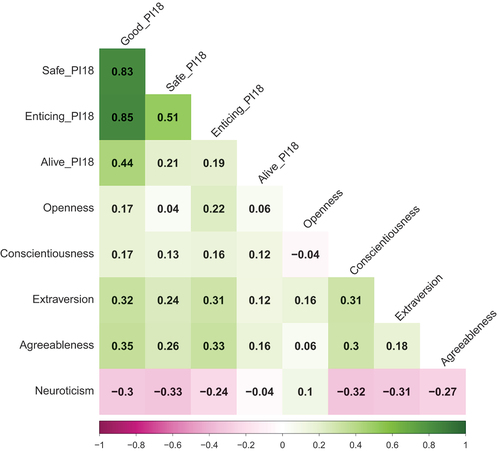
Figure 3. Phenotypic correlation: tertiary primals and personality traits.
While the shade of greenness represents stronger positive correlations, the shade of pinkness represents stronger negative correlations.
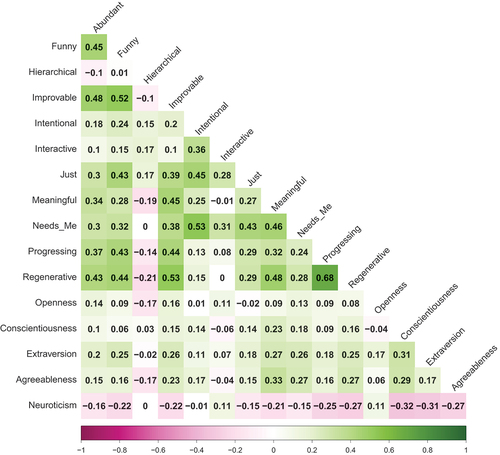
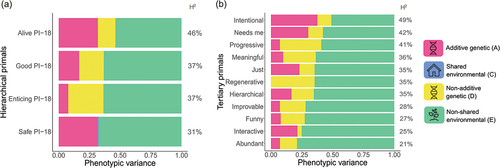
Figure 4. Full ACE/ADE models: PI-18 primals on the left (panel a) and tertiary primals on the right (panel b) with broad sense heritability (H2) shown for every primal.
Here, for all primals, the full ACE/ADE models are presented. Broad sense heritabilities (H2) are depicted for each primal (summed A plus D component for all primals, apart from Safe primal where only A depicted as ACE model was estimated). Note, for nearly all primals (except Progressive and Regenerative) more parsimonious AE models fitted better (for details see Supplementary Table S4 and S5). Interestingly, negligible shared environmental effects were found for all primals.
Supplemental material
Heritability_Primals_Supplements_Details_Twinmodelling.xlsx
Download MS Excel (176.8 KB)Heritability_Primals_Supplements_JoPP.docx
Download MS Word (1.6 MB)Heritability_Primals_Supplements_JoPP.pdf
Download PDF (901.6 KB)Data availability statement
As highly sensitive genetic data were analyzed, data can only be applied for, see https://ki.se/en/research/swedish-twin-registry-for-researchers for more information.