Figures & data
Table 1. The impact of severe sleep disruption.
Figure 1. Average sleep duration as a function of age. (a) Weekly averages of sleep duration. (b) Sleep duration for free days (open circles) and for workdays (grey dots). Curves are polynomial fits; vertical lines represent Standard Errors of the Mean (± SEM; in most cases they are larger than the respective symbols). © [Rightsholder]. Reproduced with permission of Foster et al. (Citation2013).
![Figure 1. Average sleep duration as a function of age. (a) Weekly averages of sleep duration. (b) Sleep duration for free days (open circles) and for workdays (grey dots). Curves are polynomial fits; vertical lines represent Standard Errors of the Mean (± SEM; in most cases they are larger than the respective symbols). © [Rightsholder]. Reproduced with permission of Foster et al. (Citation2013).](/cms/asset/42b5f538-db51-4fb5-b274-b93a08bebcc5/cjem_a_942666_f0001_b.gif)
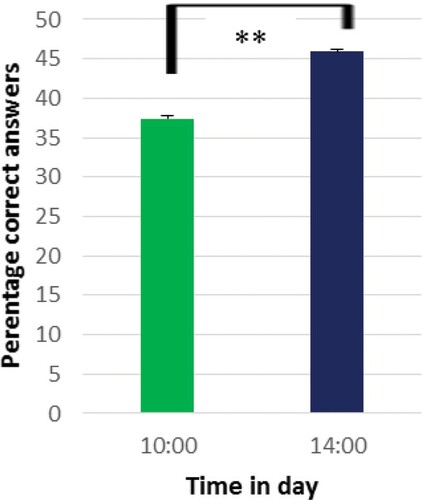
Figure 2. Test score percentage increases by time in day. Matching word pairs tests were given to subjects (n = 120) at 10:00 and 14:00. Test scores were significantly higher at 14:00. **T-test repeated measures, p < .01; effect size Cohen's d = 0.32. All data are means ± SEM.