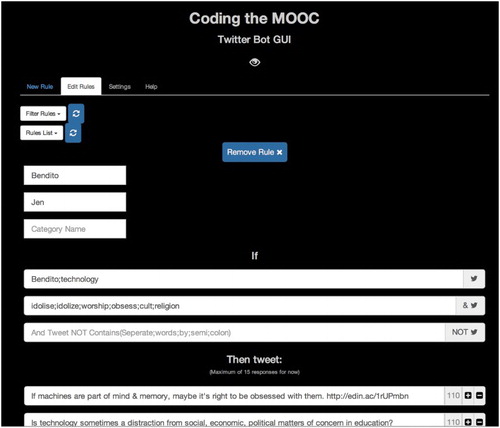
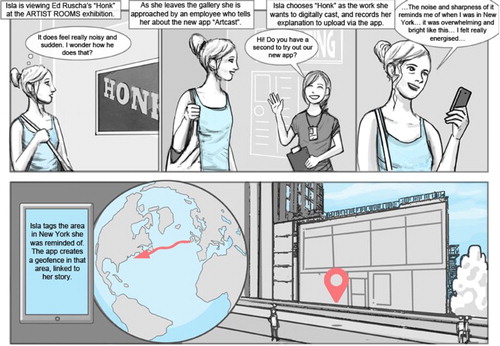
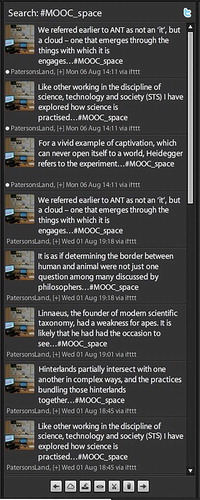
17,322
Views
53
CrossRef citations to date
0
Altmetric
Articles

Speculative method in digital education research

Pages 214-229 | Received 30 Jul 2015, Accepted 19 Feb 2016, Published online: 28 Mar 2016

Figures & data

Figure 1. Teacherbot’s graphical user interface.

Figure 1. Teacherbot’s graphical user interface.

Figure 2. Part of the visual evidence provided with the artcasting project bid. Illustration by Kevin Allen.

Figure 2. Part of the visual evidence provided with the artcasting project bid. Illustration by Kevin Allen.

Figure 3. Tweets sent by the tweeting book system.

Figure 3. Tweets sent by the tweeting book system.