
Figures & data
Figure 1. Summary of hypotheses.
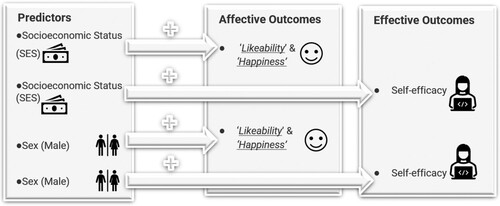
Figure 2. Line plot showing mean and 95% CIs for lower, middle, and upper-SES student responses to the question ‘How much do you like video games?’ (Like a lot, Like a little, or Don't like).
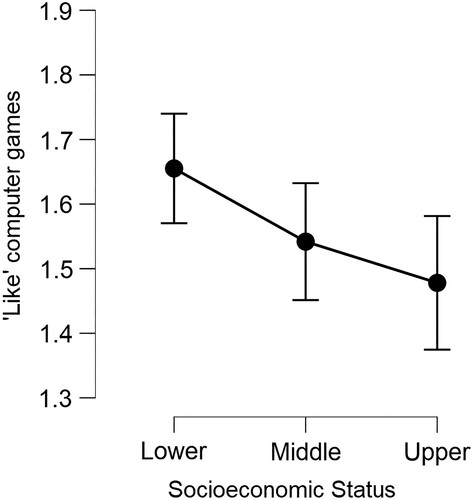
Figure 3. Line plot showing mean and 95% CIs for lower, middle, and upper-SES for boys’ and girls’ responses to the question ‘How much do you like video games?’ (Like a lot, Like a little, or Don't like).
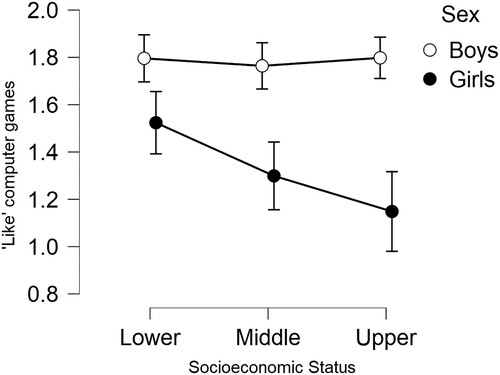
Table 1. Descriptive statistics for the effect of Sex and SES on students’ responses to the item ‘How much do you like digital games?’.
Figure 4. (A) Line plots comparing means and 95% CIs for lower, middle, and upper-SES males and females to the questions ‘How much do you like computer games?’ (Like a lot, Like a little, or Don't like). (B) ‘How do you feel when playing video games? (Playstation, X-box, PSP, etc)’ (‘Happy’, ‘Alright’, to ‘Unhappy’).
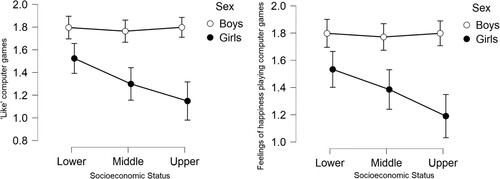
Figure 5. Line plot showing mean and 95% CIs for lower, middle, and upper-SES student responses to the item ‘Rate your digital skills (internet, games, Google search, social media)’ [Poor (0), Average (1), Good (2), Very Good (3), and Excellent (4)].
![Figure 5. Line plot showing mean and 95% CIs for lower, middle, and upper-SES student responses to the item ‘Rate your digital skills (internet, games, Google search, social media)’ [Poor (0), Average (1), Good (2), Very Good (3), and Excellent (4)].](/cms/asset/f88fd369-f837-421a-a8bc-5d9b083e39ef/cjem_a_2156537_f0005_ob.jpg)
Table 2. Descriptive statistics for the effect of SES on students’ responses to the item ‘Rate your digital skills’.
Figure 6. Line plots showing mean and 95% CIs for sex-related differences across lower, middle, and upper-SES categories. Responses relate to the item ‘Rate your digital skills’ [Poor (0), Average (1), Good (2), Very Good (3), and Excellent (4)].
![Figure 6. Line plots showing mean and 95% CIs for sex-related differences across lower, middle, and upper-SES categories. Responses relate to the item ‘Rate your digital skills’ [Poor (0), Average (1), Good (2), Very Good (3), and Excellent (4)].](/cms/asset/756bcdc7-88f6-4396-9bd4-6ec19f3cd987/cjem_a_2156537_f0006_ob.jpg)
Table 3. Descriptive statistics for the effect of Sex on students’ responses to the item ‘Rate your digital skills’ across lower, middle, and upper SES categories.