
Figures & data
Figure 1. PRISMA flowchart searching and screening of studies.
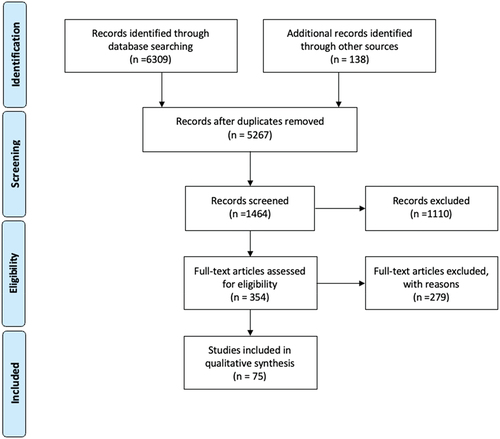
Figure 2. Global overview displaying the number of studies per country as used in this dataset.
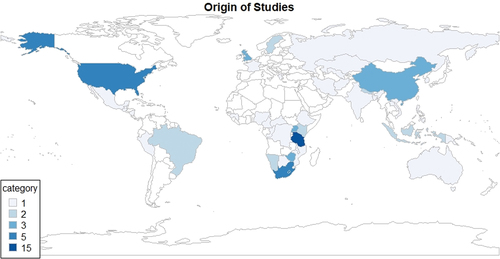
Figure 3. Bubble chart showing the count of studies (top) divided by continent, taxa and documented motivation, and the relative abundance of motivations (bottom) divided by continent and taxa.
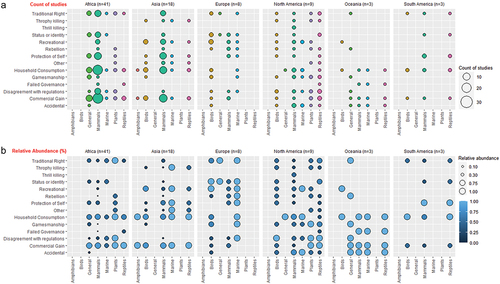
Table 1. Overview of documented motivations, descriptions, frequency of papers documenting that motivation and characteristic quotes for the specific motivations.
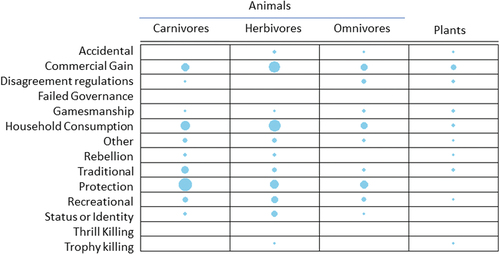
Figure 4. Documented motivations divided by dietary type of the reported taxa and plants.
Supplemental material