Figures & data
Figure 1. Structure of the Chinese tobacco industry. Source: Compiled from STMA (Citation1997) and Zhou (Citation2004).
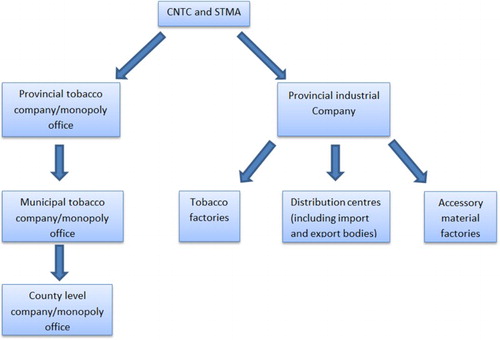
Table 1. Value and quantity of tobacco product imports 2001–2015.
Figure 2. Total number of Chinese tobacco companies (1998–2009). Source: Compiled from Liu and Ren (Citation2009) and STMA (Citation2000, Citation2002, Citation2003, Citation2005, Citation2006).
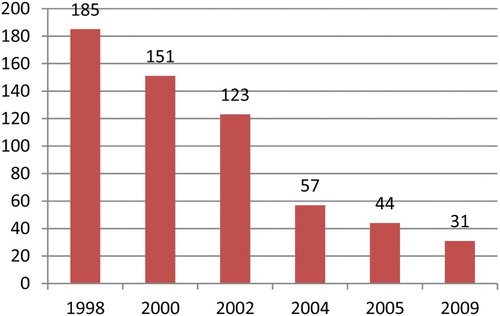
Figure 3. Number of CNTC brands (1990s–2013). Source: Anon (Citation2014).
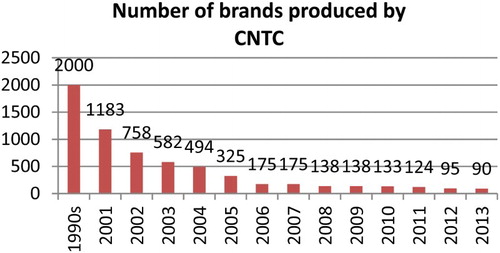
Figure 4. Value of tobacco exports, 1992–2013 (US$ millions). Source: Compiled from UN Comtrade Database (Citation2015).
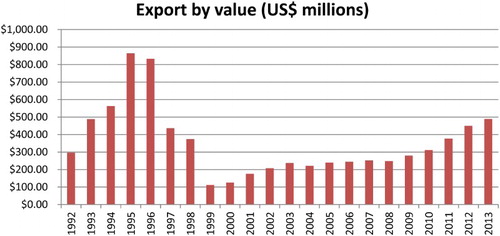
Table 2. Tobacco-related foreign-based operations by China, 1989–2015.
Figure 5. Map of distribution of CNTC’s foreign-based operations. Source: Compiled from BAT (Citation2013), Hongta Group (Citation2010), STMA (Citation2006, Citation2009, Citation2012), Tobacco-free Kids (Citation2010).
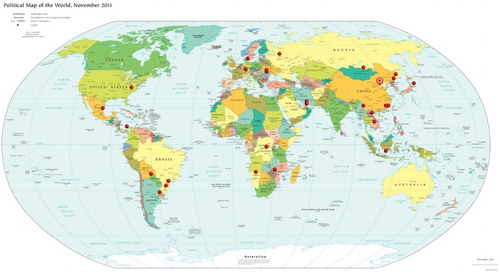
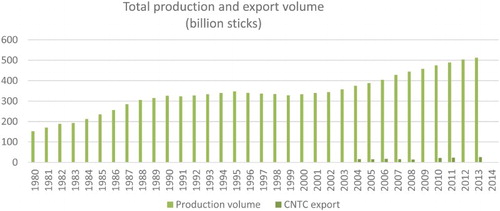
Figure 6. CNTC annual production and export in billions of sticks (1980–2013). Source: Compiled from STMA (Citation1996–2014).