Figures & data
Figure 1. Cigarette sales Japan. Domestic vs. imported brands, 1982–2014. Source: Compiled from Japan Health Promotion & Fitness Foundation. (2015). Import Tobacco Share [data from Tobacco Institute of Japan: Tobacco Statistics] http://www.health-net.or.jp/tobacco/product/pd080000.html; Euromonitor (Citation2015a). Cigarettes in Japan. London: Euromonitor International.
![Figure 1. Cigarette sales Japan. Domestic vs. imported brands, 1982–2014. Source: Compiled from Japan Health Promotion & Fitness Foundation. (2015). Import Tobacco Share [data from Tobacco Institute of Japan: Tobacco Statistics] http://www.health-net.or.jp/tobacco/product/pd080000.html; Euromonitor (Citation2015a). Cigarettes in Japan. London: Euromonitor International.](/cms/asset/f1bef389-f407-44b9-9620-b4049d90cacc/rgph_a_1273368_f0001_b.gif)
Figure 2. Japan, smoking prevalence by gender. 1965 to 2014 (20 yrs+). Source: Japan Health Promotion & Fitness Foundation. Adult Smoking Rate [JT’s Japan Smoking Rate Survey] http://www.health-net.or.jp/tobacco/product/pd090000.html.
![Figure 2. Japan, smoking prevalence by gender. 1965 to 2014 (20 yrs+). Source: Japan Health Promotion & Fitness Foundation. Adult Smoking Rate [JT’s Japan Smoking Rate Survey] http://www.health-net.or.jp/tobacco/product/pd090000.html.](/cms/asset/9eff01e4-8bd3-40eb-ab4f-3a67bf1afb76/rgph_a_1273368_f0002_b.gif)
Figure 3. Japan Tobacco: revenue by segment and percentage, 2015. Source: Japan Tobacco Inc. (2016). Annual Report FY2015.
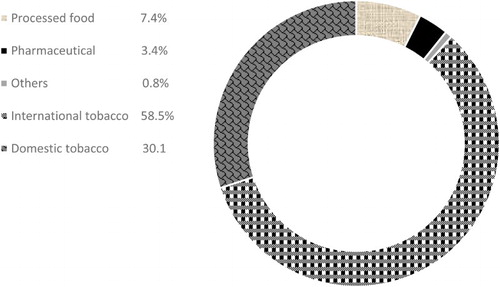
Table 1. Japan Tobacco acquisitions, 1992–2015 (JTI from 1999).
Figure 4. Global Cigarette Volume Sales Versus Japan Tobacco Sales, 2011–2014. Source: JTI annual report 2015.