
Figures & data
Figure 1. The overall network obtained by merging the five subnetworks together. The two white dots in the center are the two actors with highest power centrality.
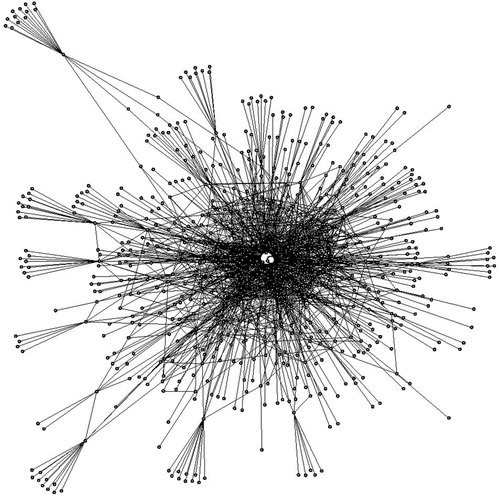
Figure 2. Numbers of respondents in the clusters of the health subnetwork (n = 373). The coloring of the tips of some of the bars reflects the presence of influential members.
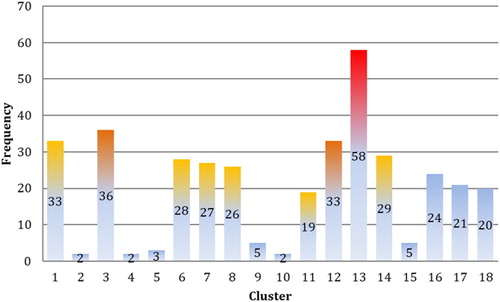
Table 1. Socio-demographic characteristics of the respondents.
Table 2. Number of Dekabusa residents in largest component per subnetwork, and remainder number of people.
Figure 3. Distributions of power, based on the combined network data (top) and on the health network data (bottom).
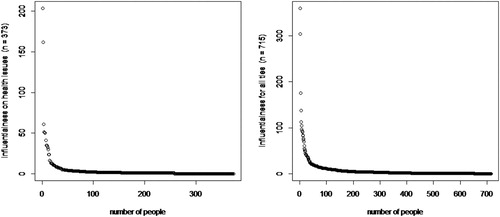
Table 3. The most central people in the health information network, limited to residents of Dekabusa.
Table 4. Centrality (indegree) for different sub-populations.
Supplemental material