
Figures & data
Figure 1. Daily number of infected cases and online survey time period.
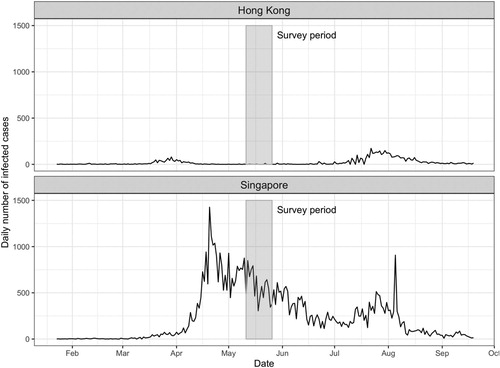
Figure 2. Compliance with self-protective behaviour (1 = very inaccurate, 7 = very accurate). Note: t-test is statistically significant when *p < 0.1; **p < 0.05; ***p < 0.01.
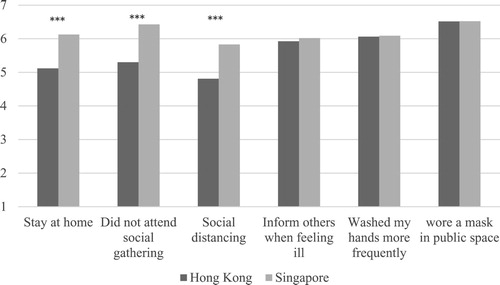
Figure 3. Apple mobility data trends in Hong Kong and Singapore.
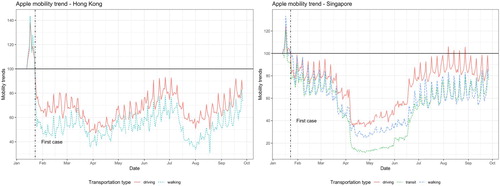
Figure 4. Trust level in public institutions, Hong Kong vs. Singapore. Note: t-test is statistically significant when *p < 0.1; **p < 0.05; ***p < 0.01.
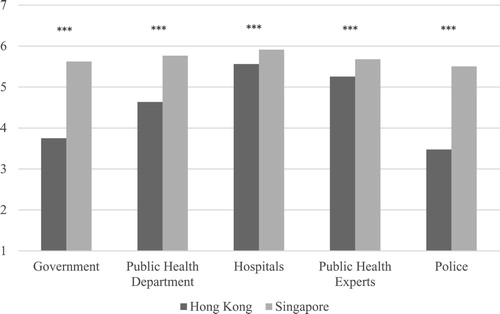
Figure 5. GDELT news tone, Hong Kong vs. Singapore.
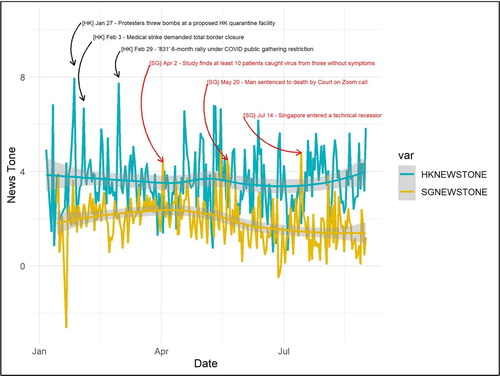
Figure 6. Contribution to disease containment effort (1=very insignificant, 7=very significant). Note: t-test is statistically significant when *p < 0.1; **p < 0.05; ***p < 0.01.
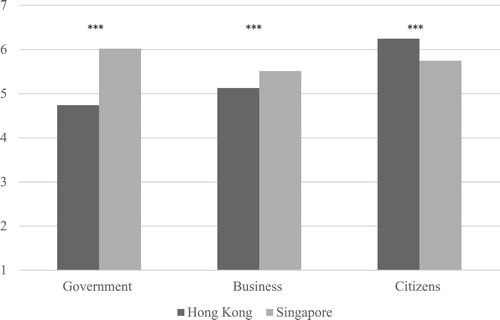
Table 1. Descriptive statistics of key variables of interest.
Table 2. Descriptive statistics of control variables.
Table 3. OLS regression models for Hong Kong.
Table 4. OLS regression models for Singapore.
Data availability statement
The data that support the findings of this study are available from the corresponding author upon request.