Figures & data
Figure 1. Total deaths from COVID-19 per million people (March 2020 to March 2021). Source: Constructed from data available from Our World in Data: https://github.com/owid/covid-19-data/tree/master/public/data (data downloaded 10 April 2021).
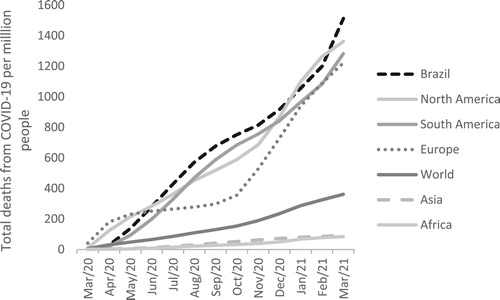
Figure 2. Residuals from Regressions 1and 2. The arrows indicate one standard deviation above and below the mean.
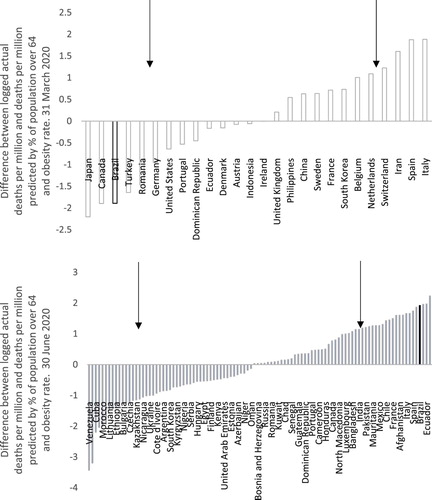
Table 1. Deaths per million as a function of underlying demographic vulnerability (obesity rate and percent of population over 64).
Figure 3. Factorial correspondence analysis representation from the Brazilian media corpus on coronavirus/COVID-19.
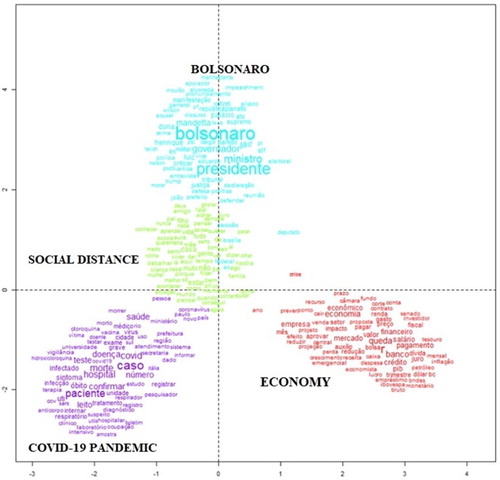
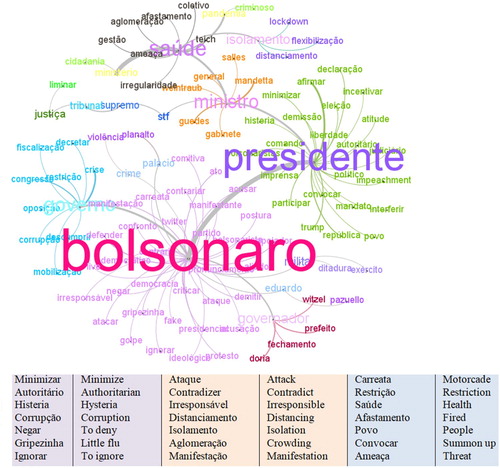
Figure 4. Sub-cluster from Bolsonaro cluster.