
Figures & data
Table 1. Documents reviewed.
Table 2. Key Informants interviewed for the study.
Table 3. Selected codes, categories and themes for the data analysis.
Figure 1. The key findings of the study according to the framework. Source: PEPFAR (President’s Emergency Plan for AIDS Relief); CDC (Centre for Disease Control and Prevention); WHO (World Health Organization); UNZA-SOM (University of Zambia School of Medicine); CHAI (Clinton health Access Intitiative); CHAZ (Chruches Health Associatrion of Zambia); and CSO (Civic Society Organizations).
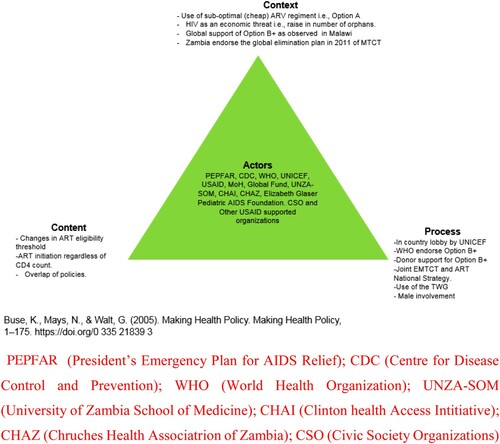
Figure 2. Description of PMTCT Policy changes over time in Zambia. Source: SD = single-dose; NVP = nevirapine; AZT = azidothymidine; and NAT = nucleic acid test.
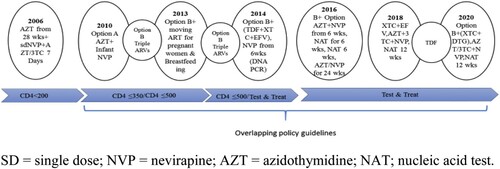
Table 4. Total spending on HIV in Zambia by source between 2015 and 2017.
Data availability statement
The dataset supporting this analysis is not available as the key informant interviews contain information that would make the participants identifiable, compromising their confidentiality.