Figures & data
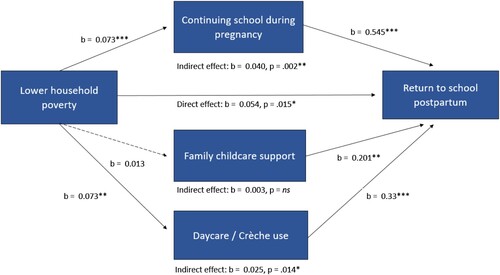
Figure 1. Conceptual framework for studying school return after birth, based on Singh and Mukherjee (Citation2018).
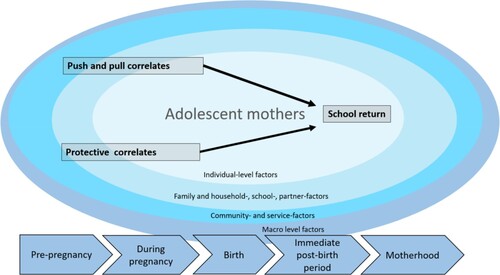
Table 1. Descriptive statistics for the sample of adolescent mothers from the Eastern Cape, South Africa (n = 911).
Table 2. Independent associations between hypothesized correlates and postpartum school return.
Table 3. Associations between hypothesized correlates and postpartum school return.
Figure 2. Tested mediation pathways towards postpartum school return. The coefficients are based on 5,000 bootstrapped samples. Mediation analyses controlled for all variables in the final model of school return (), n = 805. Dotted lines indicate hypothesised pathways that were non-significant. *p< .05. **p< .01. ***p< .001.