
Figures & data
Figure 1. Causal diagram of the mediation hypothesis.
Note: A causal diagram of the effect of care environment on HIV risk factors. All confounding variables are adjusted for in all models.
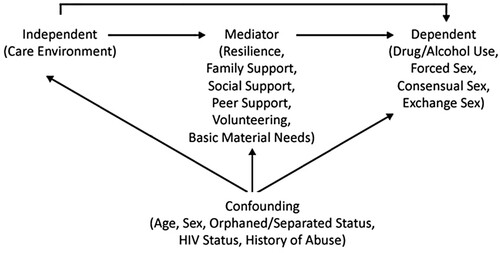
Figure 2. Mediation and interaction decomposition.
Note: The decomposition of the ERR into four components: CDE, INTref, INTmed, PIE as described in VanderWeele (Citation2014). In a mediation analysis, CDE forms the direct pathway. INTref and INTmed sum to create the interaction effect. INTmed and PIE sum to create the mediation effect. INTref, INTmed, and PIE sum to create the indirect pathway.
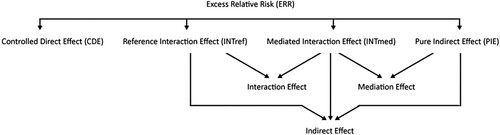
Table 1. The effect of care environment on HIV risk factors including alcohol or drug use, forced sex, consensual sex, and exchange sex due to mediation and interaction with resilience, social, and physical factors in OSAY in Western Kenya.
Table 2. Sample characteristics of OSAY (ages 10–26) in Western Kenya.
Table 3. Outcome measures at time 1 and time 2 by care environment.