
Figures & data
Figure 1. Map of the study area in Northern Ecuador with communities highlighted by urban-rural gradient.
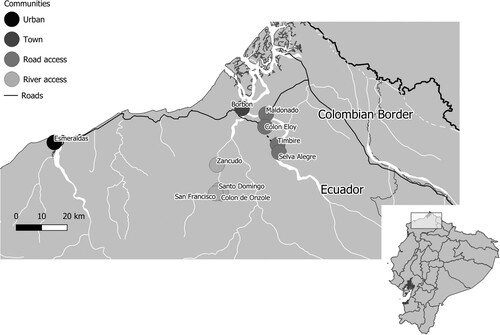
Table 1. Spearman correlations between the Hopkins’ and maternal functioning scales.
Table 2. Descriptive statistics by community, n = 508.
Figure 2. Bar graph of HSCL scores by community.* Possible range 1–4.
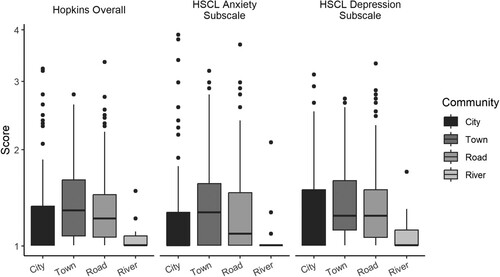
Figure 3. Bar graph of maternal functioning scores by community. * Possible range 0–4.
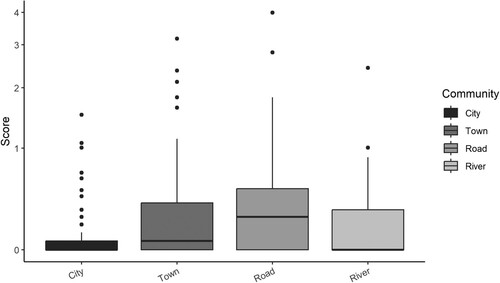
Table 3. Bivariate tobit regression models of HSCL subscales, maternal functioning, and risk factors.
Table 4. Bivariate and multivariate linear regression of overall HSCL-25 scores and risk factors for maternal depression and anxiety.
Supplemental material