
Figures & data
Figure 1. PRISMA 2020 flow diagram for the scoping review (Page et al., Citation2021).
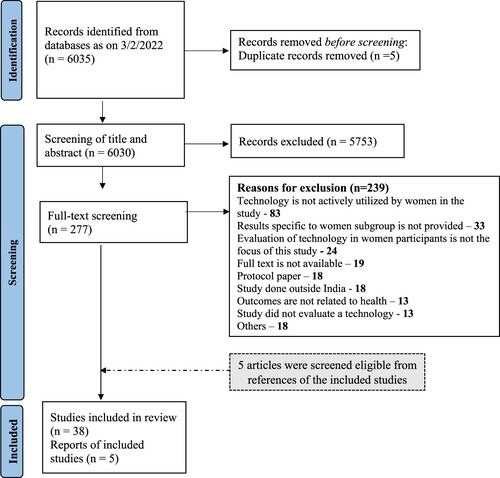
Table 1. Various technologies used by women across studies in India (n = 43 articles).
Figure 2. Thematic analysis of health outcomes assessed in studies among women in India (n = 43 articles).
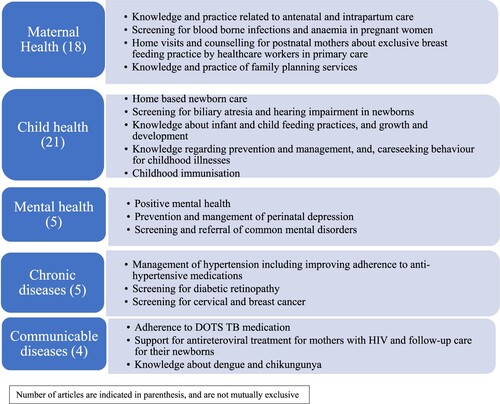
Table 2. Mapping of various technologies to health outcomes assessed in studies done among women in India.
Table 3. Barriers encountered while using technologies by women and recommendations provided in the studies.
Supplemental material
