
Figures & data
Figure 1: Period TFR in Kyrgyzstan, Kazakhstan, and Tajikistan, 1960–2018. Source: Based on data available at: http://www.demoscope.ru/weekly/ssp/sng__tfr.php
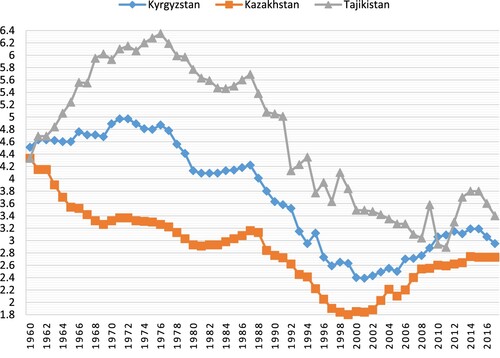
Table 1. Descriptive parameters of women in their first union, DHS2012 (weighted sample)
Table 2. Cox regressions for transitions to parity transitions (risk ratios), for women with different sex composition of children already born, DHS2012 (here and below ***p < 0.001, **p < 0.05, *p < 0.1, and SE in parentheses)
Table 3. Cox regressions for transitions to parity transitions (risk ratios), for women with different sex composition of children already born, DHS1997
Table 4. Logistic regressions for odds of contraception use, DHS2012, women in first marriage
Table 5. Cox regressions for parity transitions for subsamples of women differing on one of the parameters of family patriarchy, DHS2012
Table 6. Cox regressions for parity transitions for subsamples of women differing on one of the parameters of family patriarchy, DHS1997