
Figures & data
Figure 1. Brunei Per Capita GNI at current value among Selected OECD Countries: 2005–2020, Source: compiled and drawn from OECD (Citation2022).
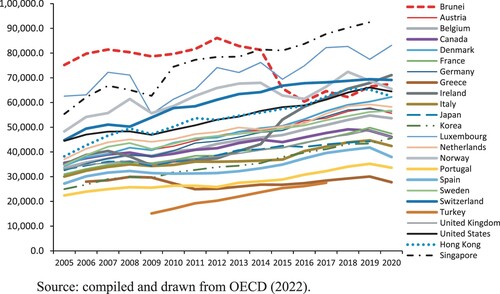
Table 1. Monthly Household Income by Income Bracket.
Table 2. Monthly Household Expenditure by Expenditure Bracket.
Table 3. National Monthly Household Income and Expenditure (in BND).
Figure 2. The trend in Household Distribution by Income Bracket: Brunei, 2005, 2010 and 2015, Source: Drawn from .
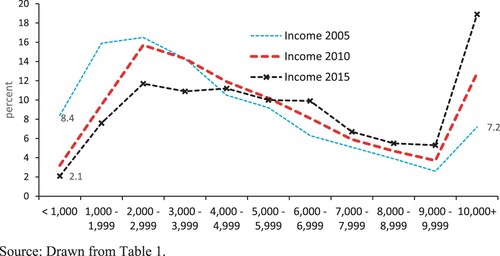
Table 4. The Estimated Brunei Monthly Household Poverty Lines (MHPLs) following World Bank Poverty Lines.
Figure 3. The trend in Household Distribution by Expenditure Bracket: Brunei, 2005, 2010 and 2015, Source: Drawn from .
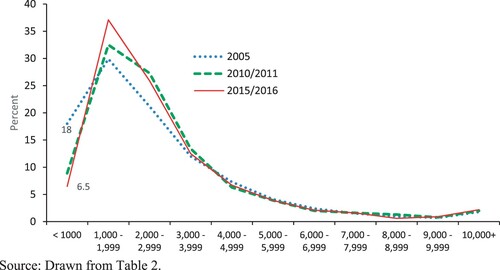
Table 5. Estimated Monthly Household Poverty Rates in Brunei based on the World Bank Poverty Lines: Income and Expenditure Approaches.
Table 6. Estimated Poverty Rates based on Poverty Line in High-Income Countries: Brunei, 2005, 2010 and 2015