Figures & data
Figure 1. A computer drawing of the continuation and stopping regions and
formed by the optimal exercise boundary
and its estimates
and
.
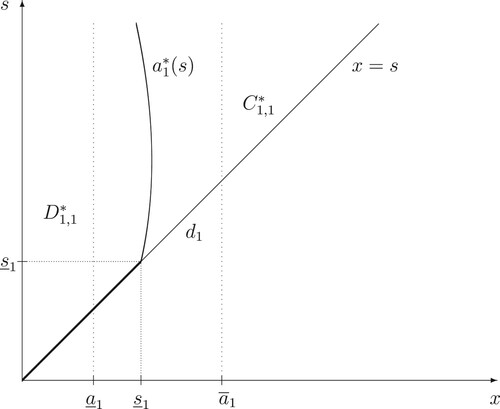
Figure 2. A computer drawing of the continuation and stopping regions and
formed by the optimal exercise boundary
and its estimates
and
.
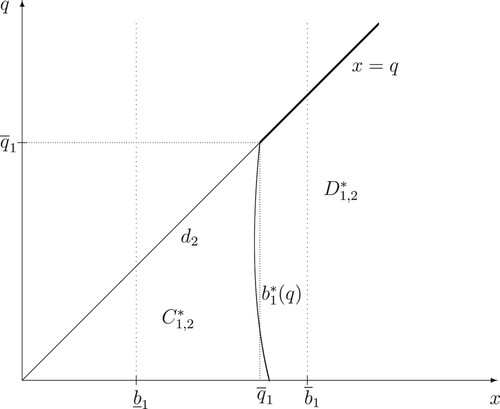
Figure 3. A computer drawing of the continuation and stopping regions and
formed by the optimal exercise boundary
and its estimates
and
.
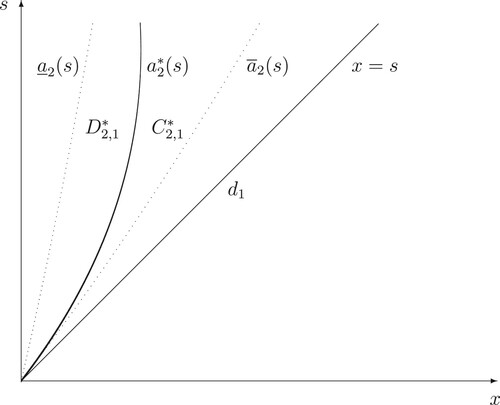
Figure 4. A computer drawing of the continuation and stopping regions and
formed by the optimal exercise boundary
and its estimates
and
.
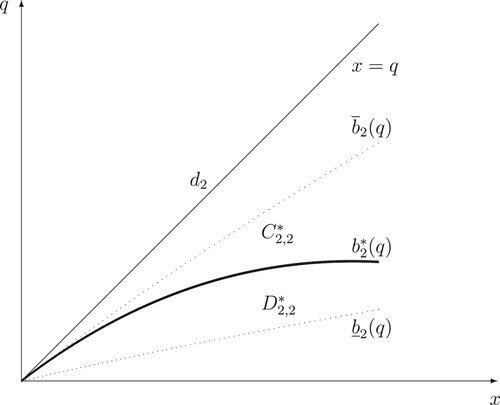
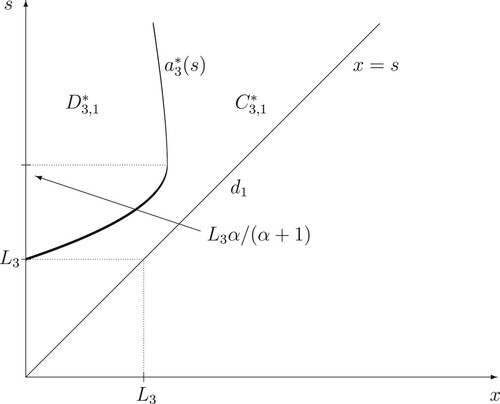
Figure 6. A computer drawing of the continuation and stopping regions and
formed by the optimal exercise boundary
and the points
and
.
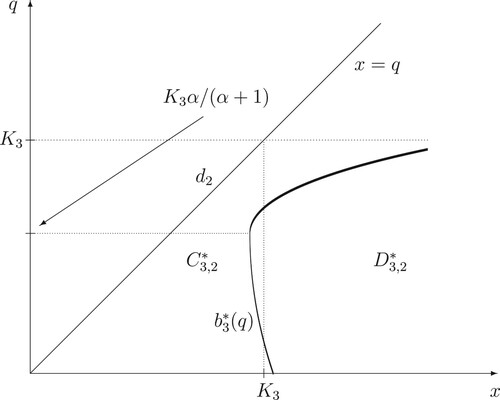
Figure 5. A computer drawing of the continuation and stopping regions and
formed by the optimal exercise boundary
and the points
and
.