Figures & data
Figure 1. A computer drawing of the value functions and
and the optimal exercise boundaries
and
in the case
.
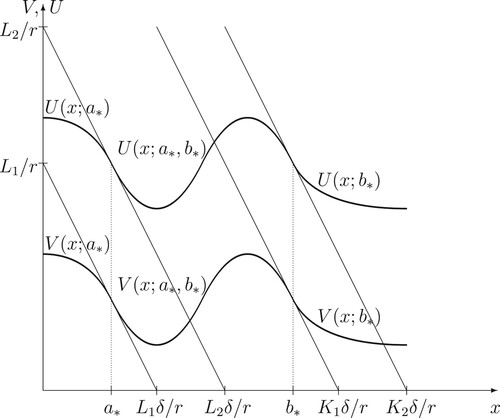
Figure 2. A computer drawing of the value functions and
and the optimal exercise boundaries
and
in the case
.
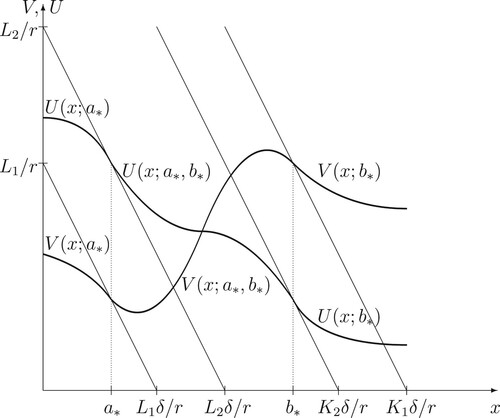
Figure 3. A computer drawing of the value functions and
and the optimal exercise boundaries
and
in the case
.
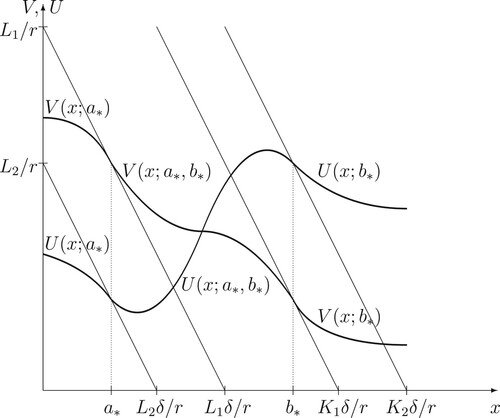
Figure 4. A computer drawing of the value functions and
and the optimal exercise boundaries
and
in the case
.

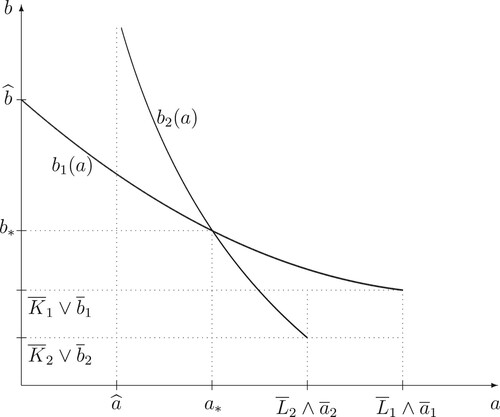
Figure A1. A computer drawing of the boundary functions and
.