Figures & data
Figure 1 A picture of the 20-m R/V Stephan used for full-scale trials with the body- and earth-fixed coordinate systems attached.
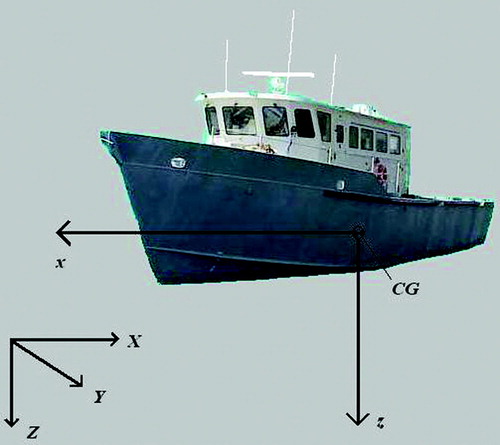
Figure 2 Diagram showing the flow of analog and digital streams between the data acquisition system and sensors. The blocks represent major components and lines show how they are connected.
Figure 3 A picture of the portable data acquisition system used to record data during full-scale trials. This data acquisition system has several inputs and outputs in the back of the pelican box housing, and also includes an IMU, tilt sensor, compass, NMEA multiplexer, analog filtering and power board, and a PC104 stack.
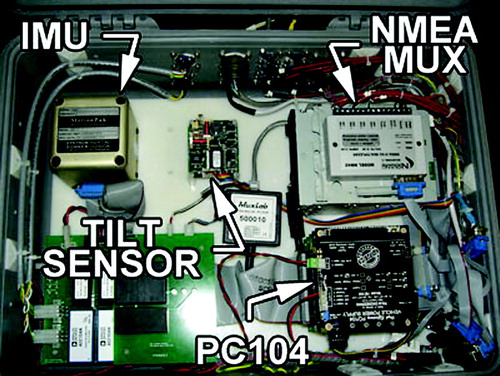
Figure 4 The RPM sensor system attached to the propeller shaft of the R/V Stephan during trials. The pickup, which is attached to the bracket, senses the bolts in the shaft collar as the shaft rotates, and sends a binary signal to the rate sensor.
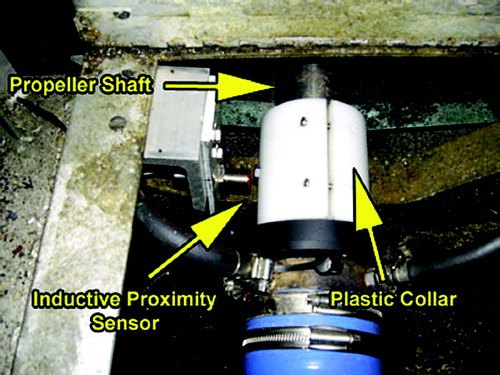
Figure 5 A 1200-kHz ADCP used to record the relative water velocity below the test vessel during trials. This ADCP was installed in a through hull fitting at approximately midship.
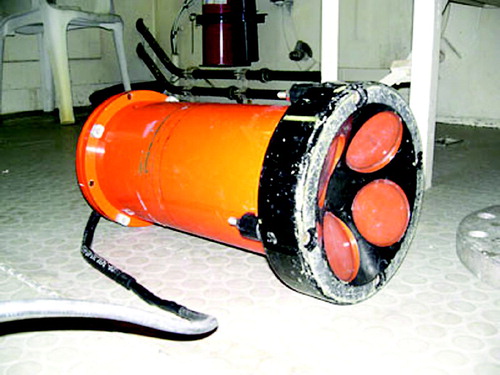
Figure 6 The dual GPS antennas and DGPS beacon antenna affixed to the R/V Stephan during trials. During measurements, the antennas were mounted on the back deck of the vessel.
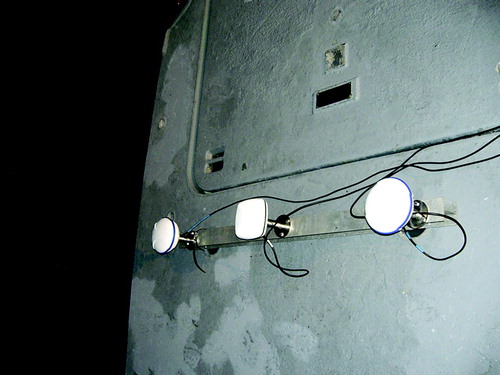
Table 1 Summary of average environmental conditions measured during trials. Wind speed and direction are recorded at an adjacent shore-based meteorological station for the first two trials, and measured using an onboard wind sensor for the third sea trial. The current speed and direction were measured using a ship mounted ADCP, and the significant wave height is based on observations
Figure 7 Surge velocity measured relative to the earth for straight-line runs at different propeller RPM and minimal rudder deflection where (+) indicates data from a vessel with a dirty hull. The legend gives the mean wind speed during each run and the mean direction the wind is blowing toward with respect to the heading of the vessel. The solid line is third-order curve fit to clean hull data, and the dashed line is a third-order curve fit to dirty hull data.
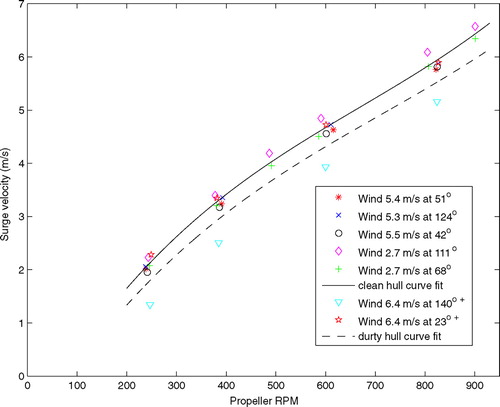
Figure 8 Surge velocity measured relative to the water for forward straight-line runs at different propeller RPM and minimal rudder deflection where a (∗) indicates that current data is not available and thus is normalized with respect to the estimated current and (+) indicates data from a vessel with a dirty hull. The legend gives the mean wind speed during each run and the mean direction the wind is blowing toward with respect to the heading of the vessel. The solid line is curve fit to clean hull data, and the dashed line is curve fit to dirty hull data.
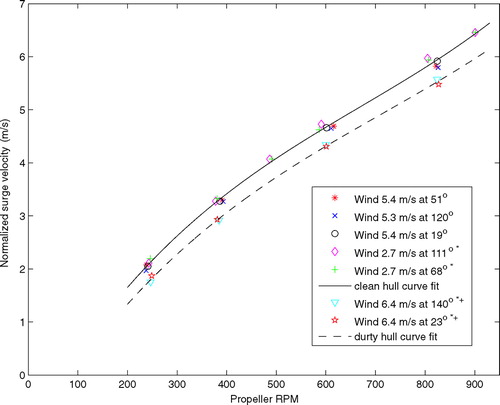
Figure 9 Residual drag coefficient derived from the clean hull straight-line runs by estimating and removing the skin drag and propeller thrust from the force balance in the body fixed x-direction, then solving for C R .
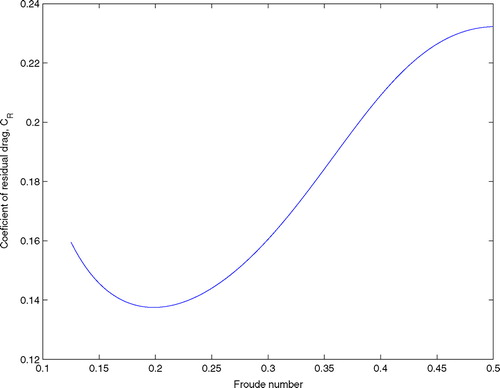
Figure 10 The propeller RPM (∗), left ordinate and surge velocity (o), right ordinate measured during forward straight-line runs with equal RPM for two engines, and minimal rudder deflection.
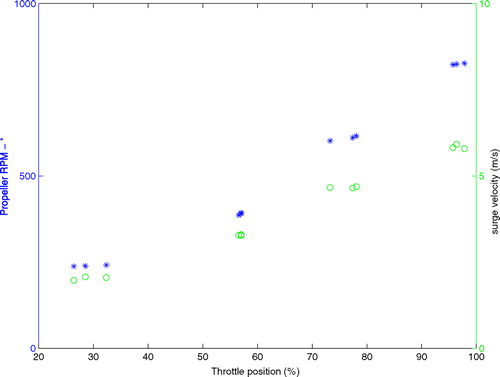
Figure 11 The backward (negative surge) velocity for reverse propeller RPM range between 230 and 425 for straight-line runs in reverse. Results are normalized and presented relative to the mean current. The legend gives the mean wind speed during the runs, and the mean direction the wind is blowing with respect to the heading of the vessel.
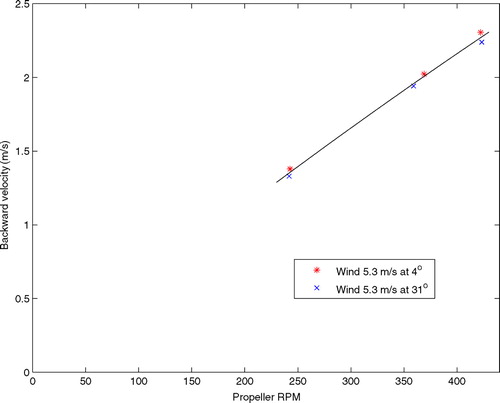
Figure 12 Magnitude of rotational velocity as a function of the absolute value of the rudder angle for both engines operating at an RPM of approximately 380. Data are presented for five different runs and the legend identifies the direction the vessel is rotating, clockwise (starboard turning rudder) and counterclockwise (port turning rudder), along with mean wind speed for each set of circular maneuvers.
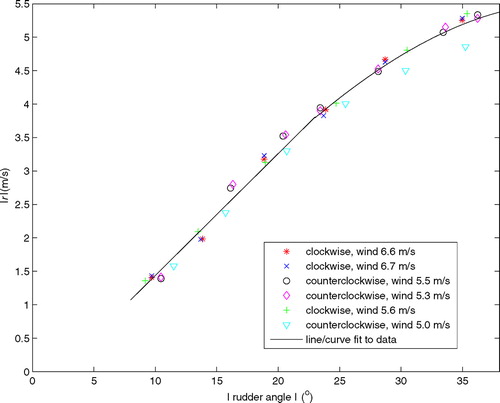
Figure 13 Surge velocity as a function of the absolute value of the rudder angle for both engines operating at an RPM of approximately 380. Data are presented for five different runs and the legend identifies the direction the vessel is rotating, clockwise (starboard turning rudder) and counterclockwise (port turning rudder), along with mean wind speed for each set of circular maneuvers and the dashed line is the forward velocity when moving in a straight line.
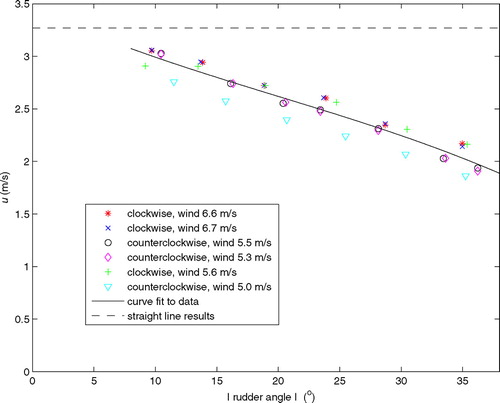
Figure 14 Magnitude of the sway velocity as a function of the absolute value of the rudder angle for both engines operating at an RPM of approximately 380. Data are presented for five different runs and the legend identifies the direction the vessel is rotating, clockwise (starboard turning rudder) and counterclockwise (port turning rudder), along with mean wind speed for each set of circular maneuvers.
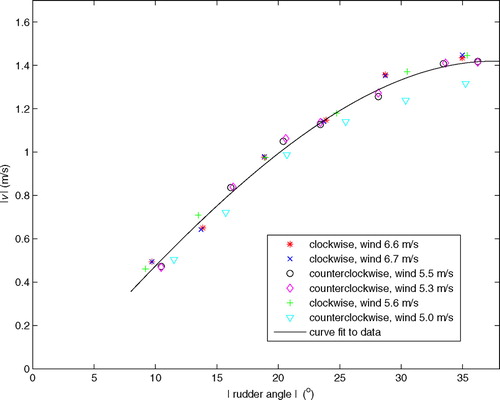
Figure 15 The sway velocity squared (v 2) of which sway drag is a function and the product of surge velocity and rotation rate (ur) of which centripetal acceleration is a function, for an RPM of 380, as a function of rudder angle.
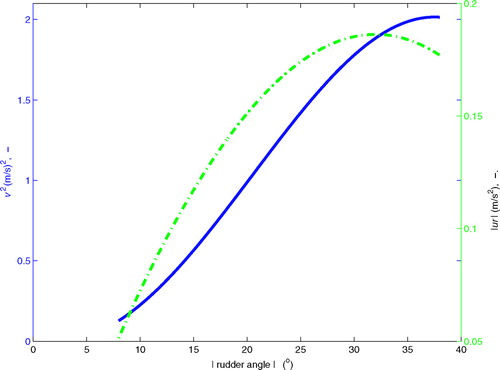
Figure 16 Magnitude of rotational velocity as a function of the absolute value of the rudder angle for both engines operating at an RPM of approximately 580. Data are presented for five different runs and the legend identifies the direction the vessel is rotating, clockwise (starboard turning rudder) and counterclockwise (port turning rudder), along with mean wind speed for each set of circular maneuvers.
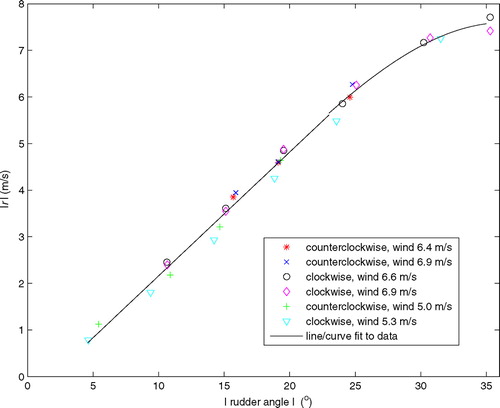
Figure 17 Surge velocity as a function of the absolute value of the rudder angle for both engines operating at an RPM of approximately 580. Data are presented for five different runs and the legend identifies the direction the vessel is rotating, clockwise (starboard turning rudder) and counterclockwise (port turning rudder), along with mean wind speed for each set of circular maneuvers and the dashed line is the forward velocity when moving in a straight line.
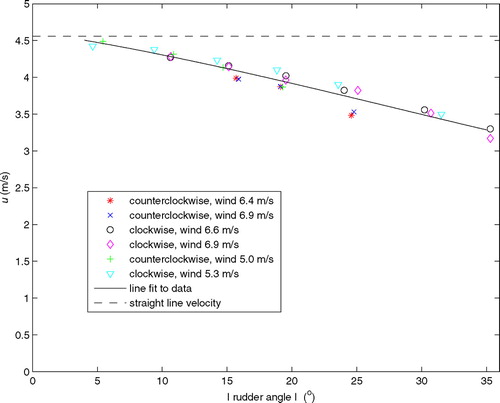
Figure 18 Magnitude of the sway velocity as a function of the absolute value of the rudder angle for both engines operating at an RPM of approximately 380. Data are presented for five different runs and the legend identifies the direction the vessel is rotating, clockwise (starboard turning rudder) and counterclockwise (port turning rudder), along with mean wind speed for each set of circular maneuvers.
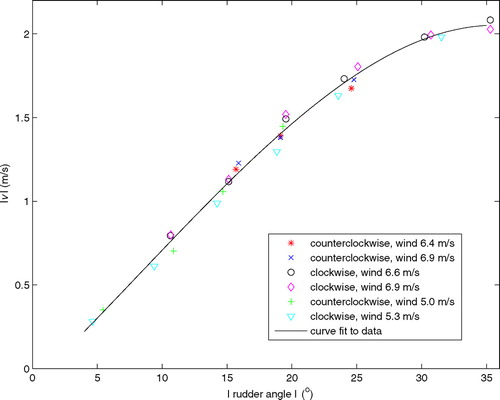
Figure 19 Angular velocity and average propeller RPM measured for trials 2 and 3, with one engine in forward, one engine in reverse, and a rudder angle of approximately 0°. The (∗) indicates that the wind speed is not measured on the vessel, but is instead measured at a nearby meteorological station.
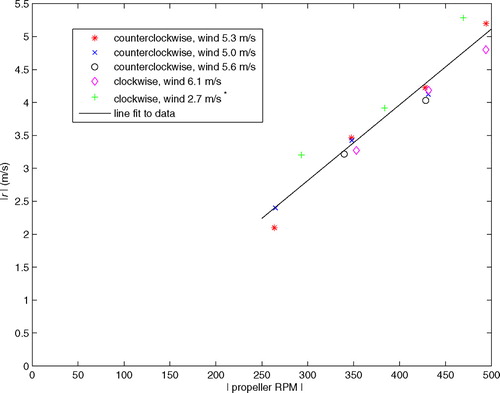
Figure 20 Propeller RPM and rotational velocity for different propeller RPM and minimal rudder deflection, with each propeller having equal RPM, but thrusting in opposite directions.
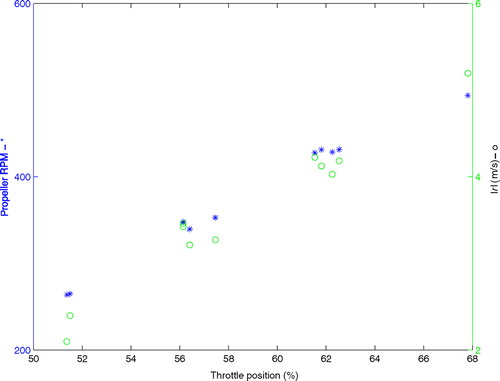
Figure 21 (a) Time series of the throttle position (b) and propeller RPM, when the vessel is accelerated from a state of drift until the vessel reaches its maximum speed without engaging the turbochargers. The solid lines are a filtered average of the measured data.
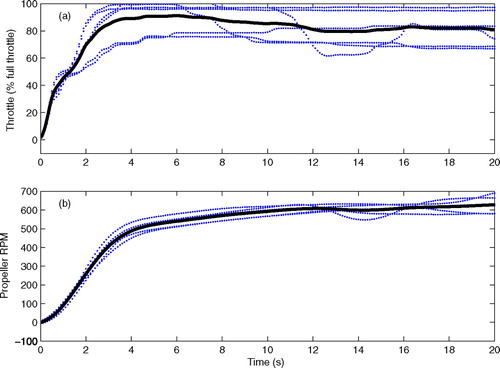
Figure 22 Time series of the throttle position and propeller RPM during the initial stages of acceleration. The horizontal difference between two lines is the lag between throttle actuation and propeller response.
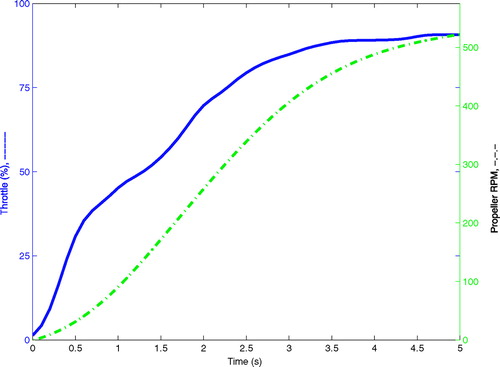
Figure 23 Time series of forward speed relative to water (a) and forward acceleration (b), when the vessel is accelerated from a state of drift until the vessel reaches its maximum speed without engaging the turbochargers. The solid lines are a filtered average of the measured data.
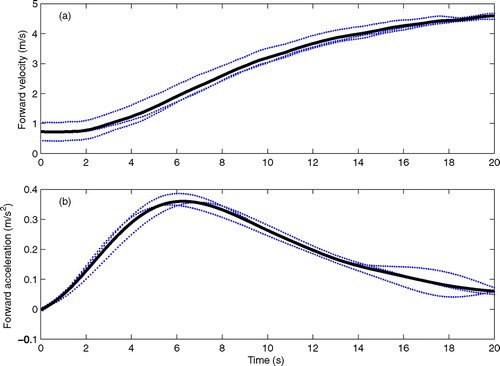
Figure 24 Time series of the throttle position (a) and propeller RPM (b), when the vessel is decelerated from maximum forward velocity without operating the turbochargers to a drift. The solid lines are a filtered average of the measured data.
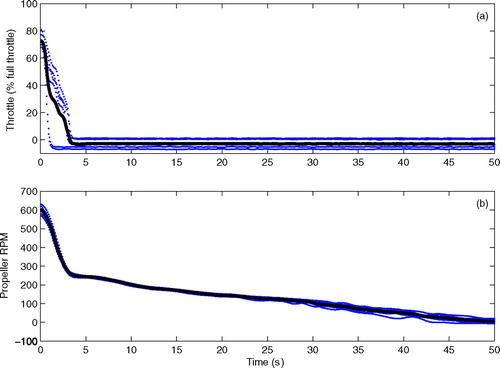
Figure 25 Time series of the throttle position and propeller RPM during the initial stages of deceleration. The dashed blue line indicates the throttle setting where the clutch disengages and the minimum in gear propeller RPM. The horizontal difference between two lines is the lag between throttle actuation and propeller response.
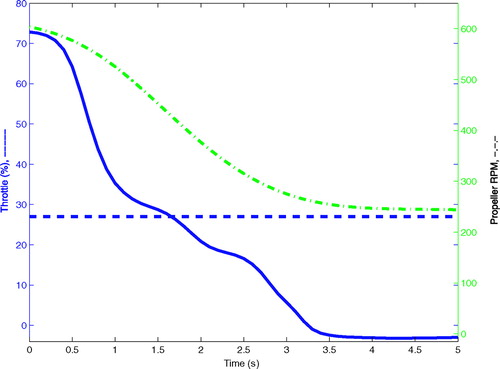
Figure 26 Time series of the forward velocity relative to the water (a) and forward acceleration (b), when the vessel is decelerated from maximum forward velocity without operating the turbochargers to a drift. The solid lines are a filtered average of the measured data.
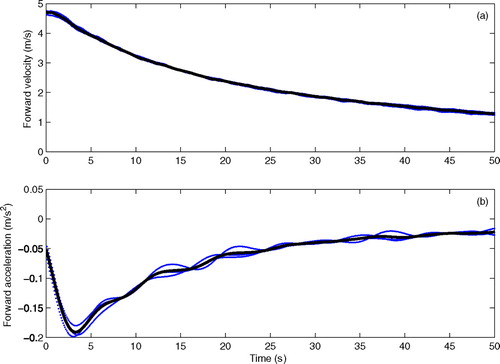
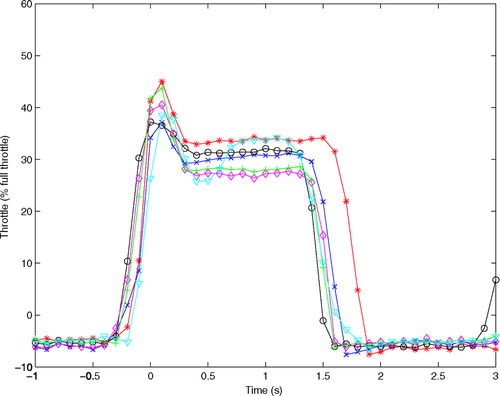
Figure 27 Time series of the rudder position when it is deflected at a maximum rate from one maximum deflection angle to the other.
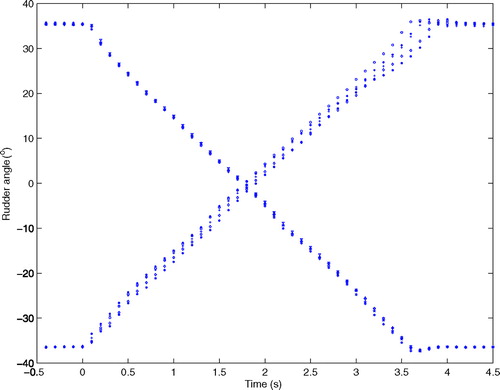
Figure 28 Time series of the propeller RPM when quickly actuating the throttle from neutral to full throttle while the boat is nearly stationary. The data points are from 17 different tests, and the solid line is a curve fit to this data.
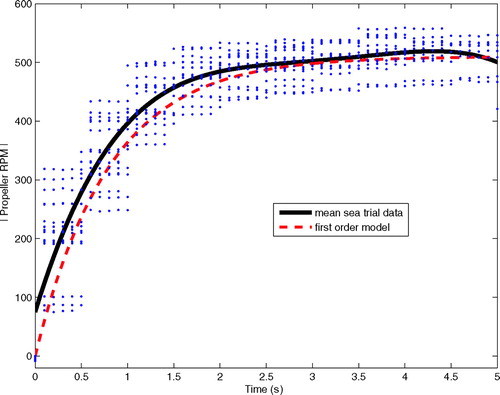
Figure 29 Time series of the propeller RPM when quickly actuating the throttle from near full throttle to neutral while the vessel is nearly stationary. The data points are from 17 different tests, and the solid line is curve fit to this data.
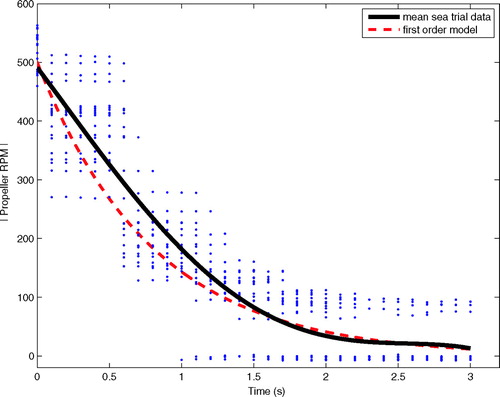
Figure 30 Time series of the throttle position (a) and propeller RPM (b) when switching from forward to reverse as quickly as the Captain feels is safe when the in-gear RPM is near the minimum RPM of the vessel and the motion of the vessel was minimal. The gears engage when the throttle is at approximately 27% of its actuation range.
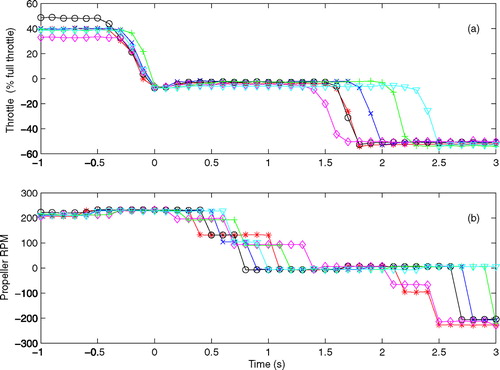
Figure 31 Time series of the throttle position (a) and propeller RPM (b) when switching from forward to reverse as quickly as the Captain feels is safe when the in-gear RPM was near the maximum RPM of the vessel, the engine is not in turbo, and the motion of the vessel is minimal. The gears engage when the throttle is at approximately 27% of its actuation range.
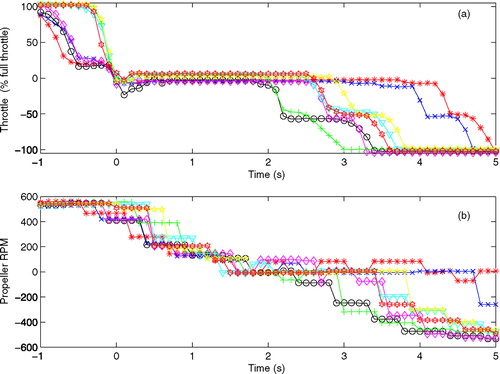
Figure 32 Time series of throttle position when switching from forward to neutral, and then back into forward, as quickly as the Captain feels is safe when the in-gear RPM is near the minimum RPM of the vessel and the motion of the vessel is minimal. The gears engage when the throttle is at approximately 27% of its actuation range.
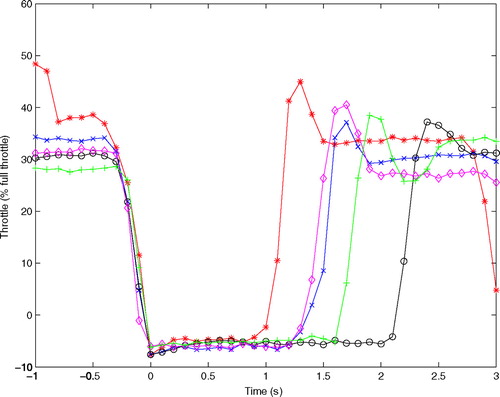
Figure 33 Time series of throttle position when switching from neutral to forward, and then back into neutral, as quickly as the Captain feels is safe when the in-gear RPM is near the minimum RPM of the vessel and the motion of the vessel is minimal. The gears engage when the throttle is at approximately 27% of its actuation range.