Figures & data
Figure 1. Rudder force conventions.
Figure 2. Conventions of twin-rudder and quadruple-rudder configurations.
Figure 3. Applied rudder profiles for multiple-rudder interaction study.
Table 1. Test configurations to analyse the impacts of the spacing and the profile on multiple-rudder configurations.
Figure 4. Applied mesh topology and boundary conditions. Adapted from Liu et al. (Citation2016).
Figure 5. Applied unstructured meshes with structured inflation layers.
Figure 6. Streamline contraction along the propeller disc.
Figure 7. Pressure distributions and stream traces of twin NACA 0018 rudders at an angle of attack of 10° with various yTR, (a) yTR/CR = 0.4., (b) yTR/CR = 0.5., (c) yTR/CR = 0.6., (d) yTR/CR = 0.7., (e) yTR/CR = 0.8., (f) yTR/CR = 0.9., (g) yTR/CR = 1.0., (h) yTR/CR = ∞. This figure is available in colour online.
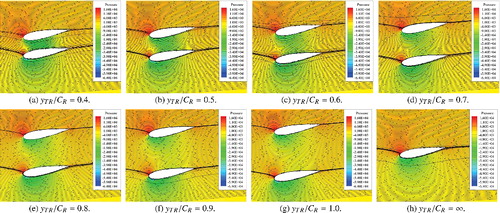
Figure 8. Lift and drag coefficients of a single NACA 0018 rudder and either side of twin NACA 0018 rudders with various yTR. This figure is available in colour online.
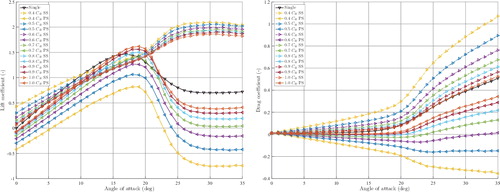
Figure 9. Total hydrodynamic coefficients of a single NACA 0018 rudder and twin NACA 0018 rudders with various yTR. This figure is available in colour online.
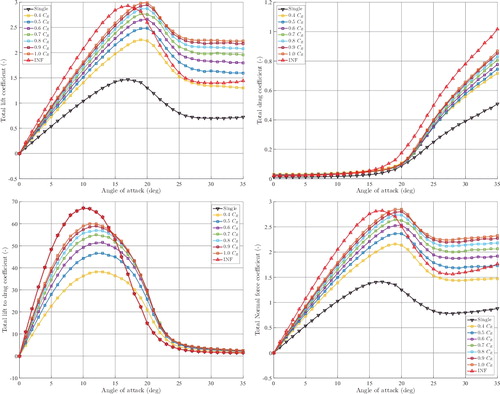
Figure 10. Pressure distributions and stream traces of twin-rudder configurations with different profiles at an angle of attack of 10° with yTR = 0.5 CR. (a) NACA 0015., (b) NACA 0020., (c) NACA 0025., (d) IFS58 TR15., (e) IFS58 TR25., (f) IFS62 TR15., (g) Wedge-tail 0015., (h) Wedge-tail 0020., (i) Wedge-tail 0025. This figure is available in colour online.
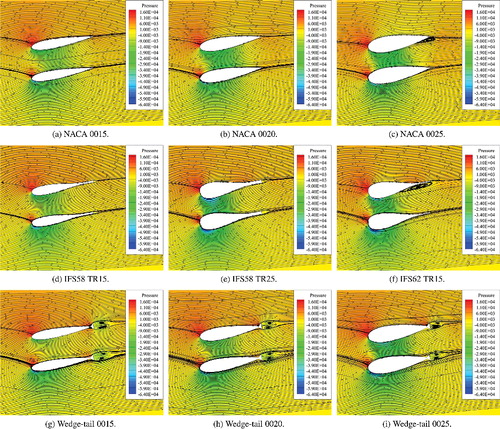
Figure 11. Pressure distributions and stream traces of twin-rudder configurations with different profiles at an angle of attack of 10° with yTR = 1.0 CR. (a) NACA 0015., (b) NACA 0020., (c) NACA 0025., (d) IFS58 TR15., (e) IFS58 TR25., (f) IFS62 TR15., (g) Wedge-tail 0015., (h) Wedge-tail 0020., (i) Wedge-tail 0025. This figure is available in colour online.
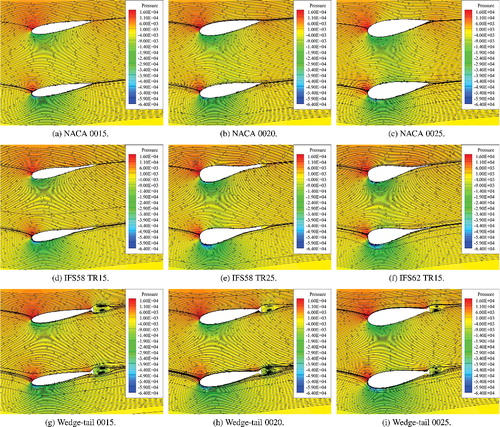
Figure 12. Total hydrodynamic coefficients of various twin rudders with yTR = 0.5 CR. This figure is available in colour online.
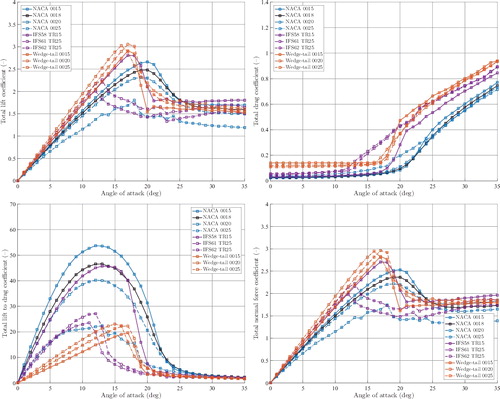
Figure 13. Total hydrodynamic coefficients of various twin rudders with yTR = 1.0 CR. This figure is available in colour online.
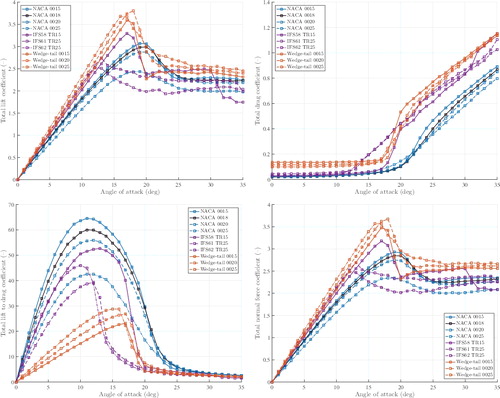
Figure 14. Pressure distribution and stream traces of quadruple-rudder configurations at angle of attack of 10° with different yTR and yTU. (a) yTR = 0.50 CR and yTU = 0.5 CR., (b) yTR = 0.50 CR and yTU = 1.0 CR., (c) yTR = 0.50 CR and yTU = 1.5 CR., (d) yTR = 0.75 CR and yTU = 0.5 CR., (e) yTR = 0.75 CR and yTU = 1.0 CR., (f) yTR = 0.75 CR and yTU = 1.5 CR., (g) yTR = 1.50 CR and yTU = 0.5 CR., (h) yTR = 1.50 CR and yTU = 1.0 CR., (i) yTR = 1.50 CR and yTU = 1.5 CR. This figure is available in colour online.
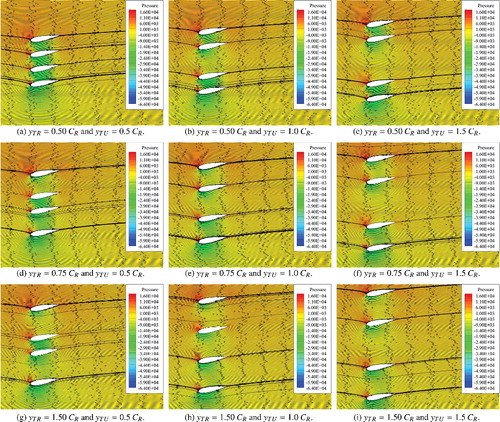
Figure 15. Lift coefficients of each rudder in a quadruple-rudder configuration compared to the lift coefficient of a single rudder. (a) yTR = 0.50 CR and yTU = 0.5 CR., (b) yTR = 0.50 CR and yTU = 1.0 CR., (c) yTR = 0.50 CR and yTU = 1.5 CR., (d) yTR = 0.75 CR and yTU = 0.5 CR., (e) yTR = 0.75 CR and yTU = 1.0 CR., (f) yTR = 0.75 CR and yTU = 1.5 CR., (g) yTR = 1.50 CR and yTU = 0.5 CR., (h) yTR = 1.50 CR and yTU = 1.0 CR., (i) yTR = 1.50 CR and yTU = 1.5 CR. This figure is available in colour online.
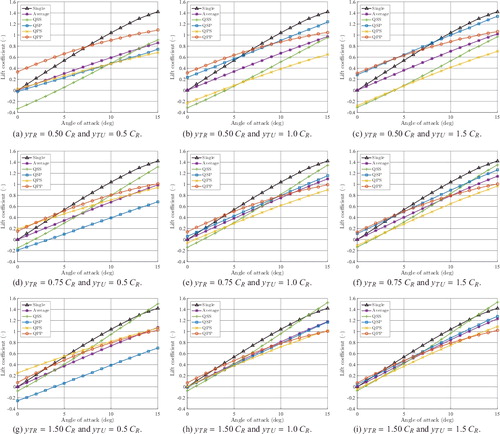
Figure 16. Drag coefficients of each rudder in a quadruple-rudder configuration compared to the drag coefficient of a single rudder. (a) yTR = 0.50 CR and yTU = 0.5 CR., (b) yTR = 0.50 CR and yTU = 1.0 CR., (c) yTR = 0.50 CR and yTU = 1.5 CR., (d) yTR = 0.75 CR and yTU = 0.5 CR., (e) yTR = 0.75 CR and yTU = 1.0 CR., (f) yTR = 0.75 CR and yTU = 1.5 CR., (g) yTR = 1.50 CR and yTU = 0.5 CR., (h) yTR = 1.50 CR and yTU = 1.0 CR., (i) yTR = 1.50 CR and yTU = 1.5 CR. This figure is available in colour online.
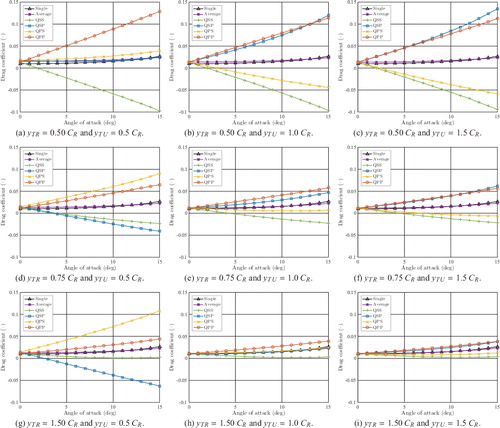
Figure 17. Total hydrodynamic coefficients of quadruple NACA 0018 rudders with various yTR and yTU. This figure is available in colour online.
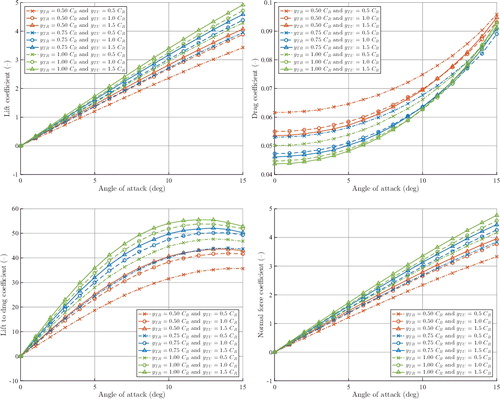
Table 2. Regression coefficients of the lift coefficients of each rudder in the twin-rudder configurations.
Table 3. Regression coefficients of the drag coefficients of each rudder in the twin-rudder configurations.
Figure 18. Surface fitting of the lift and drag coefficients of the NACA 0018 profile with different spacing. (a) Surface fitting of the lift coefficient., (b) residuals of the lift coefficient fitting., (c) surface fitting of the drag coefficient. and (d) residuals of the drag coefficient fitting. This figure is available in colour online.
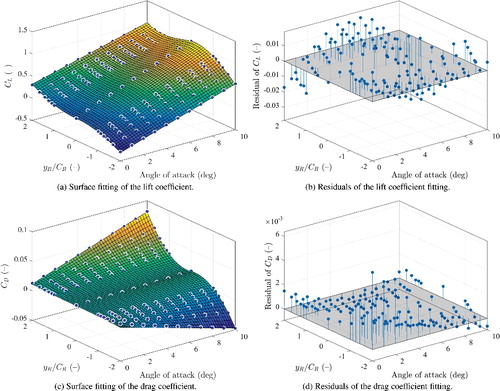
Figure 19. Comparison of predicted and tested lift coefficients of different profiles in the twin-rudder configuration with yTR = 0.5 CR. This figure is available in colour online.
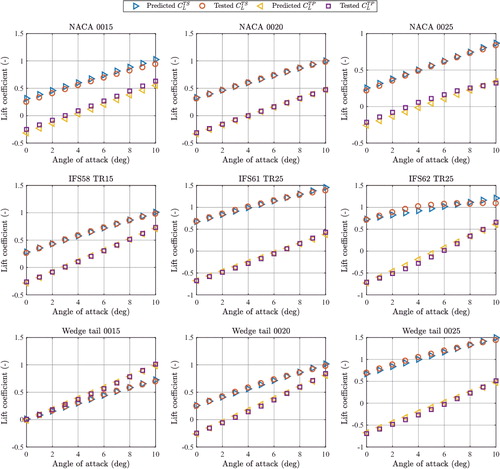
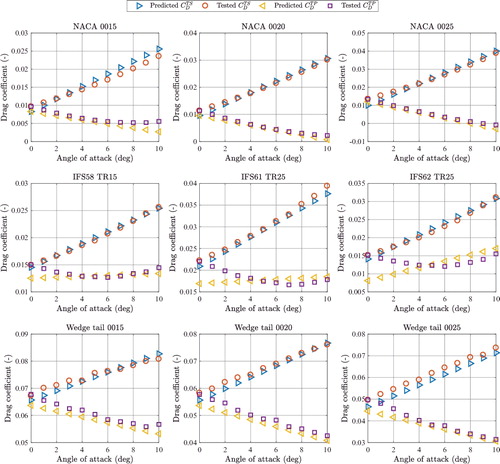
Figure 20. Comparison of predicted and tested drag coefficients of different profiles in the twin-rudder configuration with yTR = 0.5 CR. This figure is available in colour online.
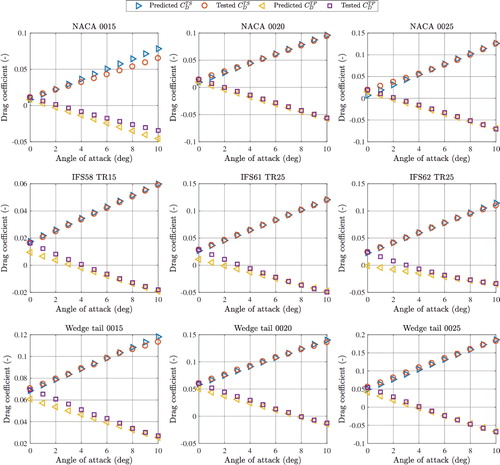
Figure 21. Comparison of predicted and tested lift coefficients of different profiles in the twin-rudder configuration with yTR = 1.0 CR. This figure is available in colour online.
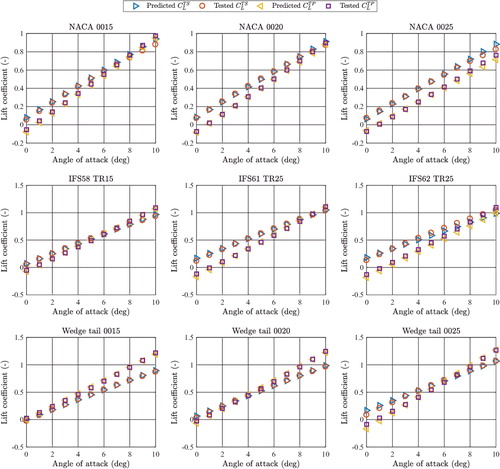
Figure 22. Comparison of predicted and tested drag coefficients of different profiles in the twin-rudder configuration with yTR = 1.0 CR. This figure is available in colour online.