Figures & data
Figure 1. Flowchart of the journey prediction model..
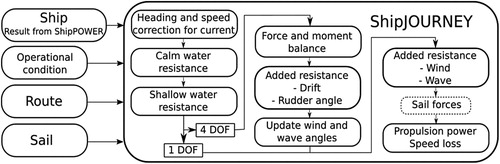
Figure 2. Coordinate system with definition of the rudder angle.
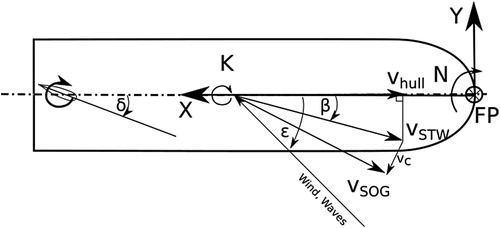
Figure 3. Side forces and levers for the estimation of heel and yaw moments.
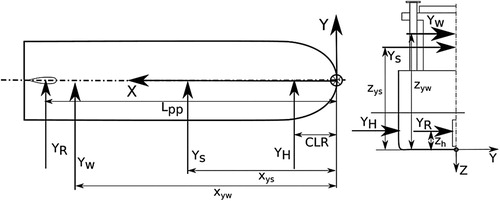
Table 1. Dimensions of example ships.
Figure 4. Illustration of the route used in the study.
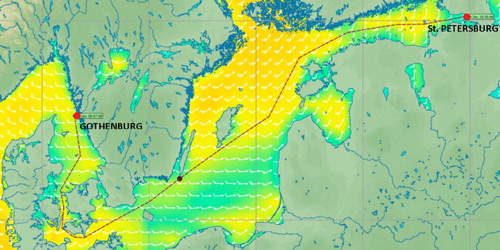
Figure 5. True wind angle (TWA), true wind speed (TWS) and waves along the route.
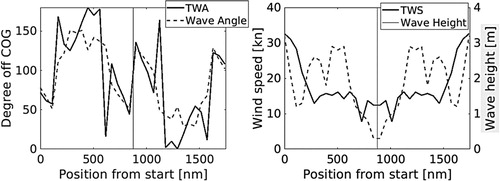
Figure 6. Comparison of the simulation results using 1 DOFand 4 DOF for the tanker and the PCTC.
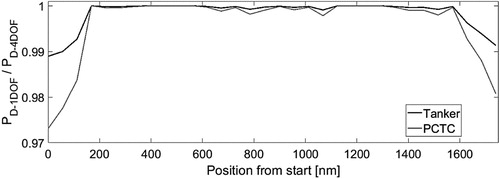
Figure 7. Involuntary speed loss for the tanker.
Figure 8. Sketch of a possible arrangement of the Flettner rotors on a tanker.
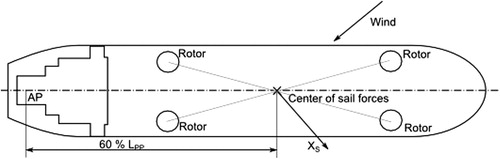
Table 2. Comparison of fuel consumption of the tanker with different sail configurations.
Figure 9. Simulation results with different sail configurations on the tanker.
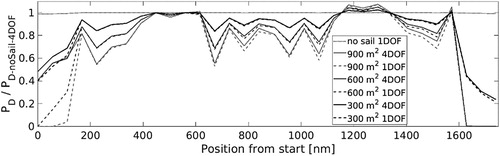
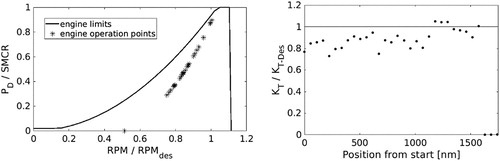
Figure 10. Engine and propeller loading with 900 m2 sail area.