Figures & data
Figure 1. Photograph of Enercon E-Ship 1 (Schmidt Citation2013). (This figure is available in colour online.)
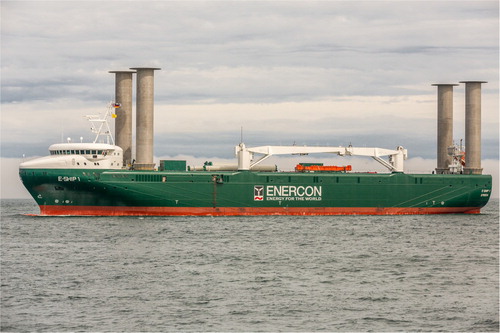
Figure 2. Illustration of the UT Wind Challenger concept (Ouchi et al. Citation2013). (This figure is available in colour online.)
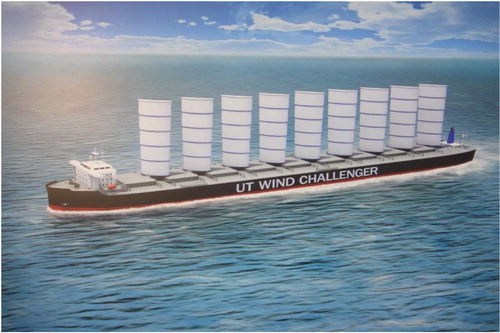
Figure 3. Illustration of the Ecoliner concept (Dykstra Naval Architect Citation2019). (This figure is available in colour online.)
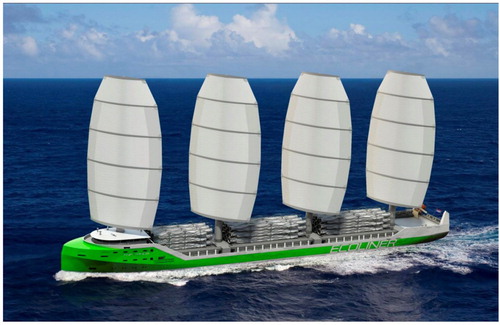
Figure 4. Schematic flowchart of ShipJOURNEY.
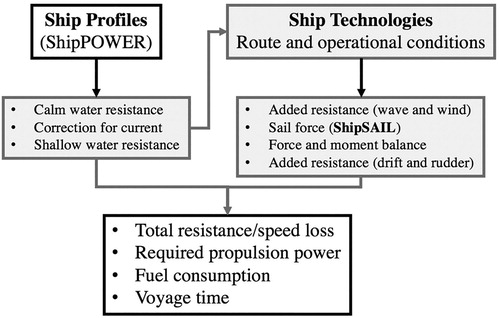
Figure 5. Schematic of forces and apparent wind velocity.
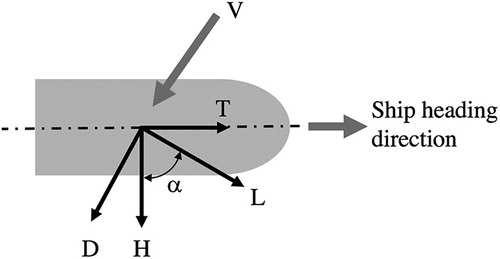
Figure 6. Polar diagram of the thrust coefficient (CT) vs. the apparent wind direction for the 1000 m2 DynaRig. (This figure is available in colour online.)
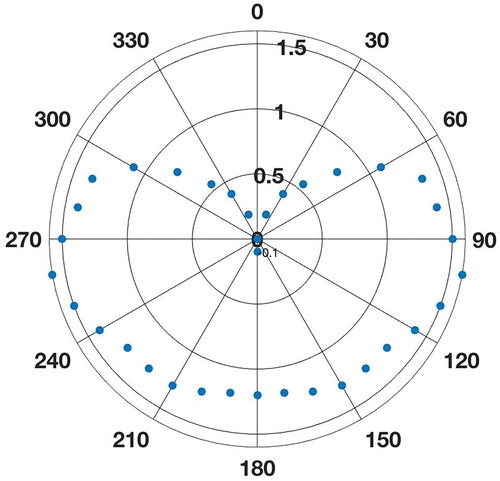
Figure 7. Heel coefficient (CH) vs. the apparent wind direction for the 1000 m2 DynaRig. (This figure is available in colour online.)
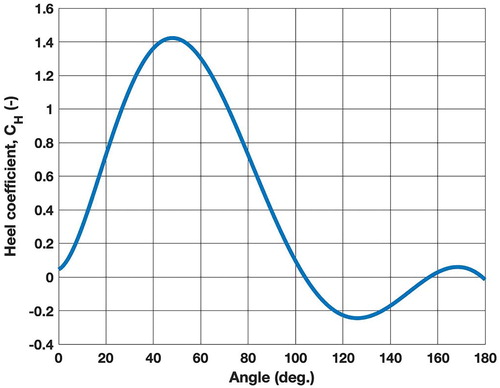
Figure 8. Polar diagram of the thrust coefficient (CT) vs. the apparent wind direction for the 1000 m2 wingsail. (This figure is available in colour online.)
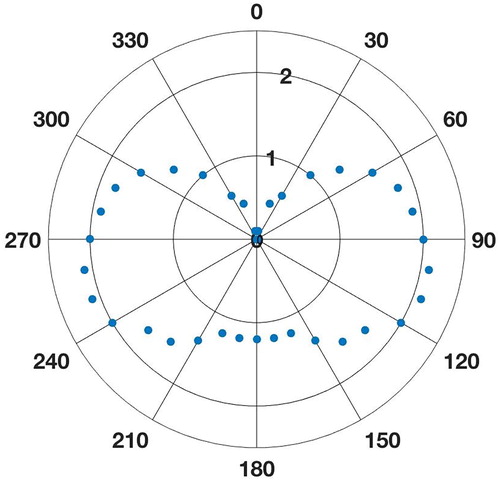
Figure 9. Heel coefficient (CH) vs. the apparent wind direction for the 1000 m2 wingsail. (This figure is available in colour online.)
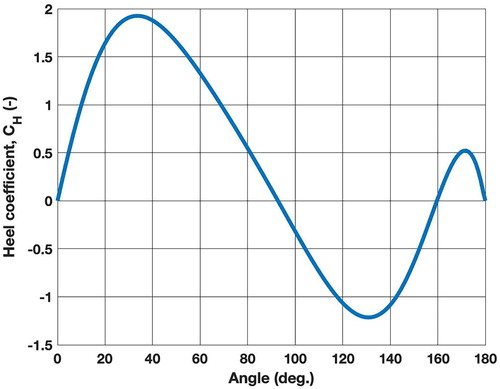
Figure 10. Polar diagram for the thrust coefficient (CT) vs. the apparent wind direction for the case study Flettner rotor. (This figure is available in colour online.)
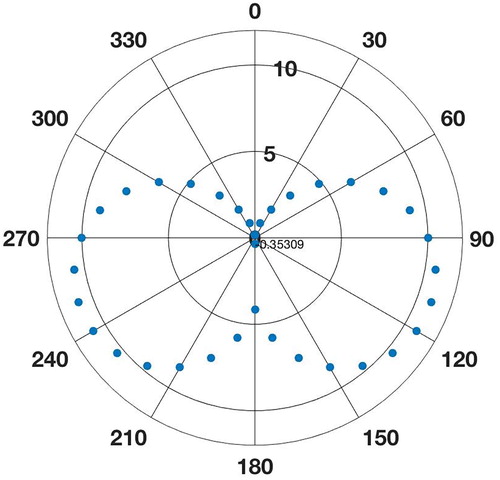
Figure 11. Heel coefficient (CH) vs. the apparent wind direction for the case study Flettner Rotor. (This figure is available in colour online.)
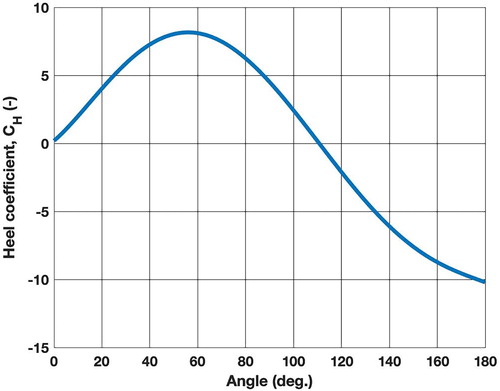
Figure 12. Route between Cape Lopez (Gabon) and Point Tupper (Canada). (This figure is available in colour online.)
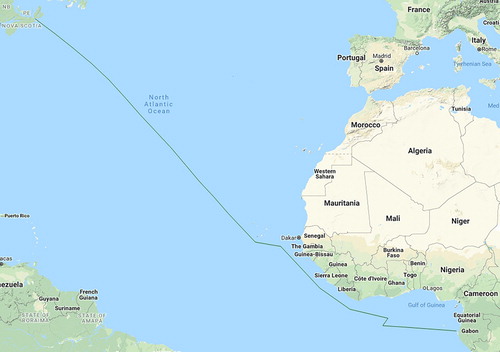
Table 1. Fuel consumption comparison for the route between Cape Lopez (Gabon) and Point Tupper (Canada).
Figure 13. Route between Angra dos Reis (Brazil) and Rotterdam (the Netherlands). (This figure is available in colour online.)
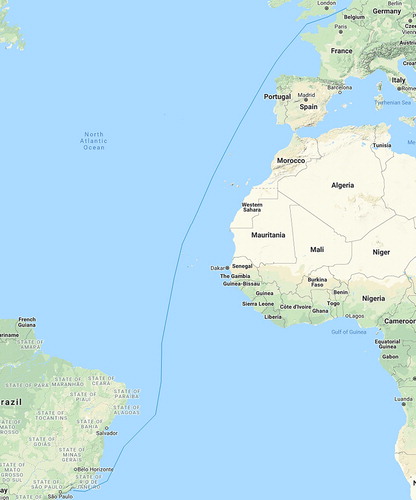
Table 2. Fuel consumption comparison for the route between Angra dos Reis (Brazil) and Rotterdam (the Netherlands).
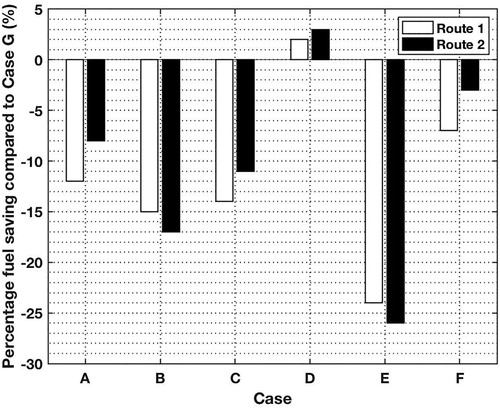
Figure 14. Fuel saving percentage compared to Case G on Route 1 and Route 2 for the Aframax Oil Tanker.
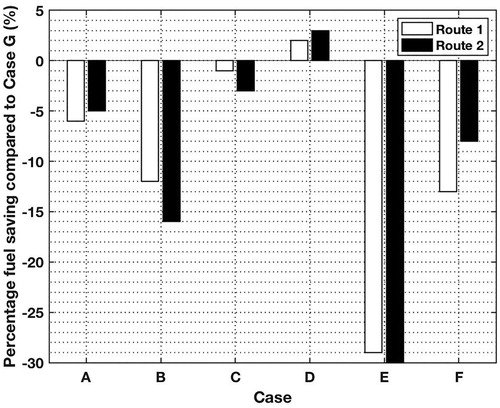
Table 3. Parametric study of the Flettner rotor for the Aframax Oil Tanker on Route 1.
Table 4. Parametric study of the Flettner rotor for the Aframax Oil Tanker on Route 2.
Figure 15. Fuel saving percentage compared to Case G on Route 1 and Route 2 for the Handysize Bulk Carrier.