Figures & data
Figure 1. The schematic of the FE model and the 4-point bending setup.
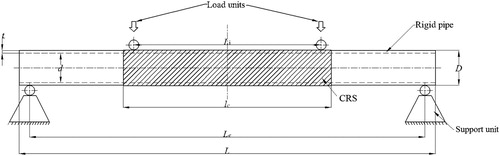
Figure 2. The location of the surface crack and the parameters of the surface crack.
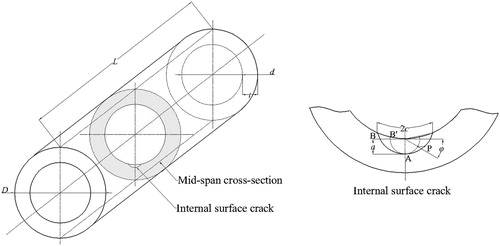
Figure 3. (a) Global mesh of the FE model and the CFRP reinforcement; (b) illustration of the surface cracked area by splitting the pipe.
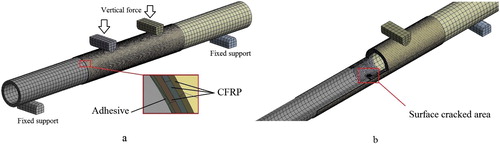
Figure 4. (a) Surface crack modelling module; (b) the mesh around the surface crack.
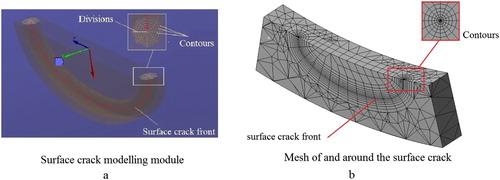
Figure 5. Wrapping pattern including longitudinal direction (L) and hoop direction (H).
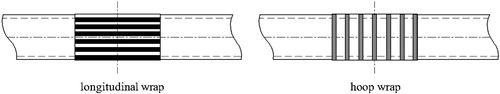
Table 1. Detail information of the phase one FE models.
Table 2. Material properties of the adhesive and CFRP (Kabir et al. Citation2016).
Figure 6. Numerical and experimental (Kabir et al. Citation2016) load–displacement response of P, and (a) P-R1, (b) P-R2.
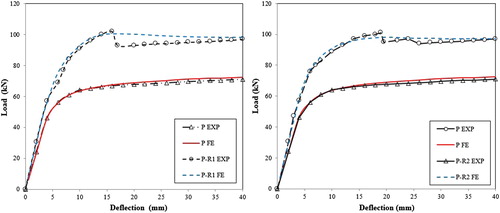
Table 3. Detail information of phase two FE models.
Figure 7. The procedure of evaluating surface crack growth.
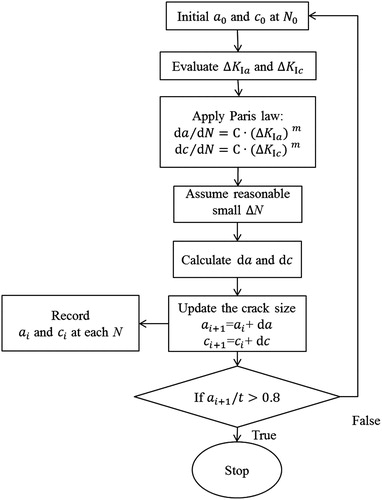
Figure 8. Comparison between the experimental results (Yoo and Ando Citation2000) and FE results: (a) a/c versus a/t ratio; (b) fatigue life.
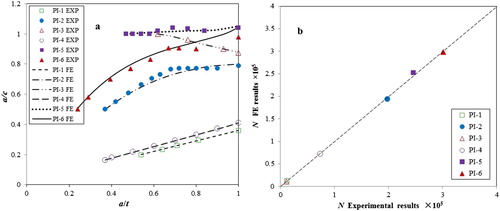
Figure 9. The global equivalent stress distribution of the pipe.
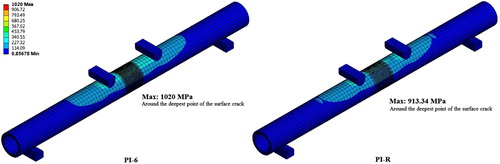
Figure 10. The equivalent stress distribution around the surface crack on the pipe internal surface.
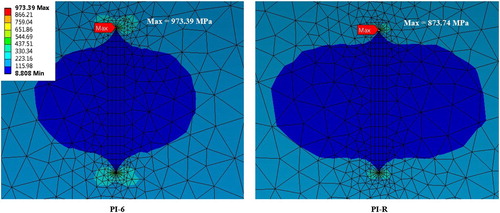
Figure 11. The comparison results between the un-reinforced FE model ‘PI-6’ and the CRS reinforced FE model ‘PI-R’: (a) crack growth rate along depth direction; (b) crack growth rate along length direction; (c) a/c versus a/t ratio.
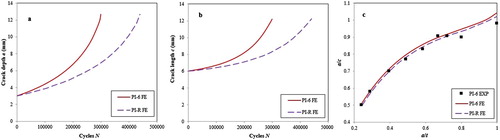
Figure 12. The normalised SIF result of FE models with different bond length: (a) normalised SIF along the crack front; (b) normalised SIF of the deepest point.
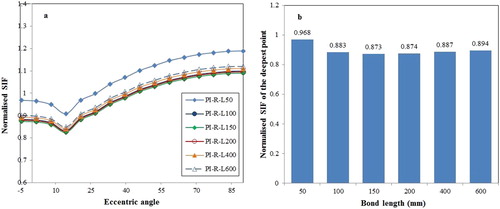
Table 4. Specimen configuration of steel pipes with various diameters and thickness, and the SIF decrease.
Figure 13. The normalised SIF result of FE models with different numbers of composite layer: (a) normalised SIF along the crack front; (b) normalised SIF of the deepest point.
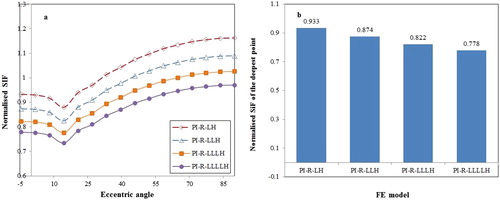
Figure 14. The normalised SIF result of FE models with different CFRP modulus: (a) normalised SIF along the crack front; (b) normalised SIF of the deepest point.
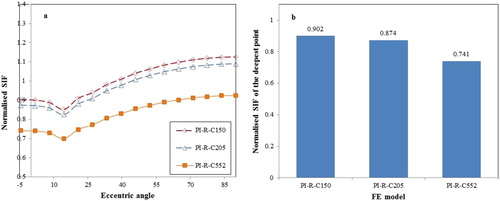
Figure 15. The normalised SIF result of FE models with different adhesive thickness: (a) normalised SIF along the crack front; (b) normalised SIF of the deepest point.
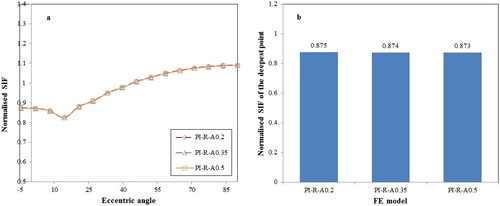
Figure 16. The stress distribution in the adhesive layer with different thickness.
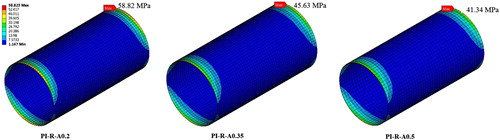
Figure 17. The normalised SIF result of FE models by using different types of adhesive: (a) normalised SIF along the crack front; (b) normalised SIF of the deepest point.
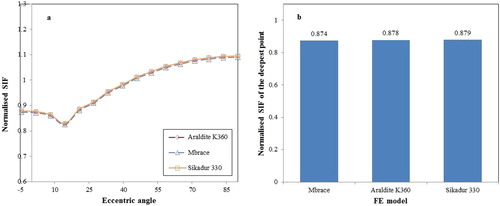
Figure 18. The stress distribution in the adhesive layer using different types of adhesive.
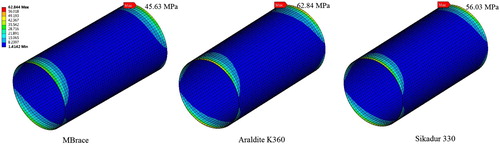
Table 5. Material properties of different type of adhesive (Kabir et al. Citation2016).
Figure 19. Wrapping scheme: (1) longitudinal and hoop wrapping; (2) inversely diagonal wrapping pattern.
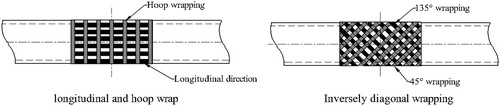
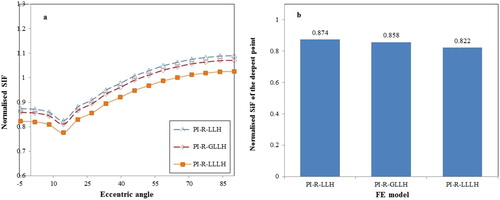
Figure 20. The normalised SIF result of FE models with different CFRP wrapping orientation: (a) normalised SIF along the crack front; (b) normalised SIF of the deepest point.
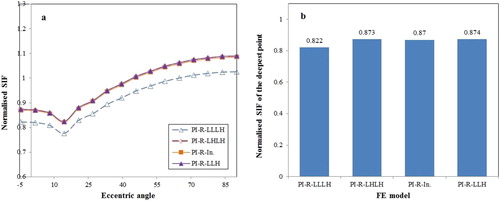
Table 6. Specimen configuration of steel pipes with different aspect ratios.
Figure 21. The normalised SIF result of FE models by using on one layer of GFRP laminate: (a) normalised SIF along the crack front; (b) normalised SIF of the deepest point.