
Figures & data
Figure 1 . A non-icebreaking vessel operating in small ice-floe condition infested on the NSR (photo credit: SCF Group) (This figure is available in colour online).
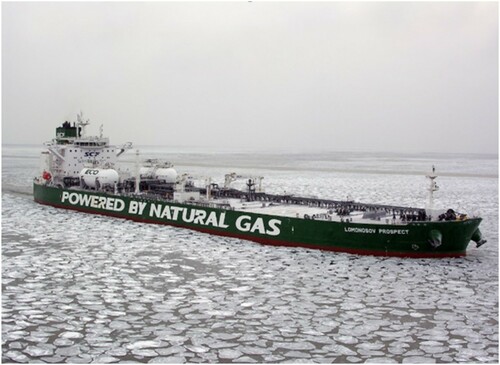
Table 1 . Comparison of SPM component calculation methods.
Table 2 . Principal variables for floe-ice resistance.
Figure 2 . Schematic of the models and data of the VPT (This figure is available in colour online).
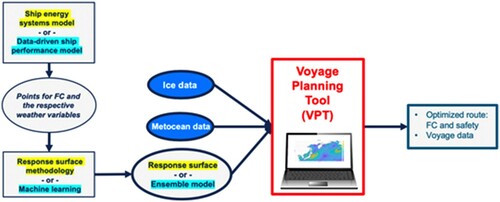
Table 3 . Particulars of the case study vessel.
Table 4 . Particulars of the propulsion system.
Table 5 . Distances, average target speeds and RPMs of the two voyages.
Figure 3 . Encountered sea ice concentration (left) and sea ice thickness in metres (right) of Voyage I (This figure is available in colour online).
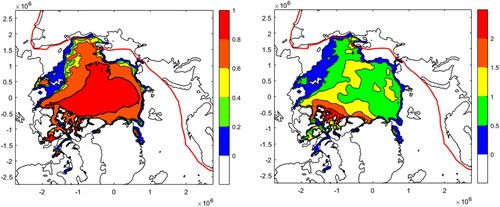
Figure 4 . The encountered significant wave height (Hs) and the LIT of Voyage I (This figure is available in colour online).
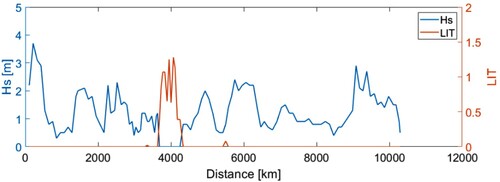
Figure 5 . Comparison of fuel consumption of Voyage I (This figure is available in colour online).
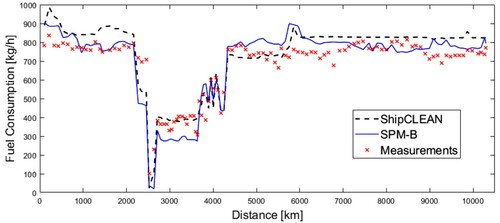
Figure 6 . Encountered sea ice concentration (left) and sea ice thickness in metres (right) of Voyage II (This figure is available in colour online).
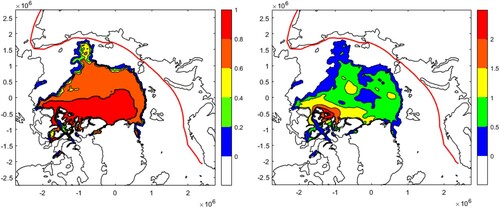
Figure 7 . The encountered significant wave height (Hs) and the LIT of Voyage II (This figure is available in colour online).
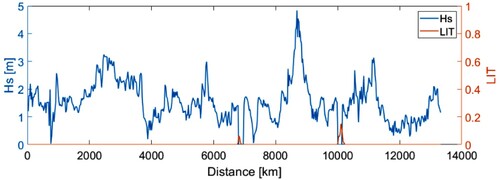
Figure 8 . Comparison of fuel consumption of Voyage II (This figure is available in colour online).
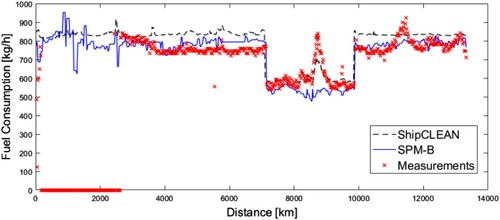
Table 6 . Total FCs in tonnes of the two voyages.