
Figures & data
Figure 1. Developed methodology flowchart (This figure is available in colour online.).
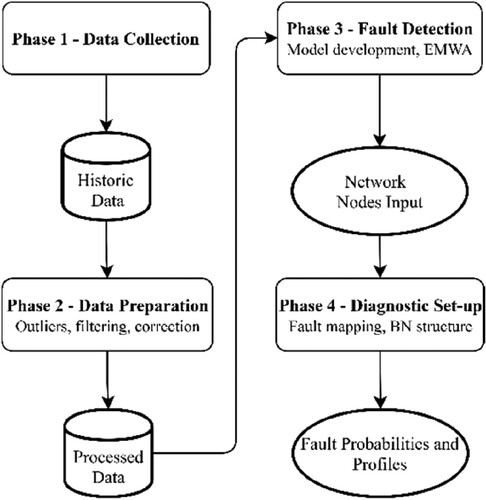
Figure 2. Sample BN with three nodes X1, X2, X3 (This figure is available in colour online.).
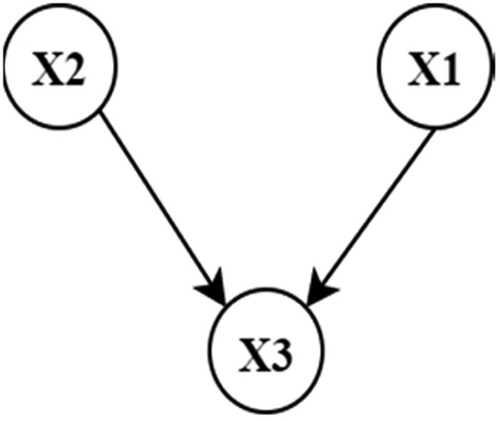
Figure 3. ME system representation (This figure is available in colour online.).
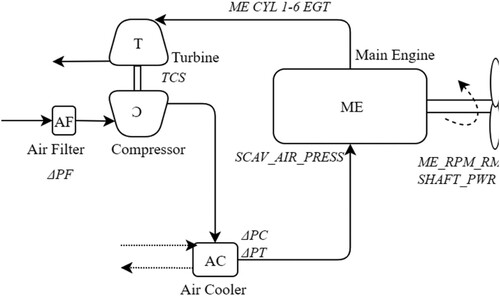
Table 1. Information for the used variables.
Figure 4. Representative sample of the application of the data preparation phase in the ME shaft power showing the prepared data (top) and raw data (bottom) The y-axis of the top graph is scaled for clarity of the visualisation (This figure is available in colour online.).
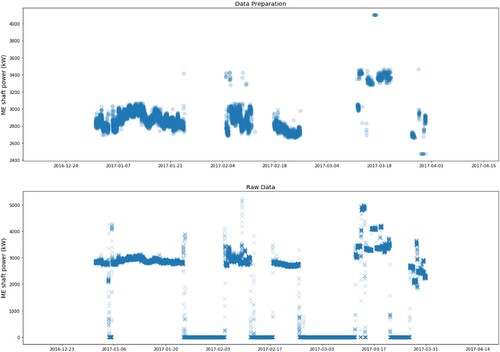
Figure 5. EWMA control chart representing healthy operating points, in the indicative example of Cylinder 1 of the ME (This figure is available in colour online.).
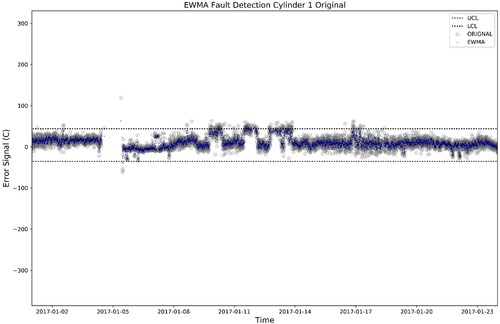
Figure 6. EWMA control chart for the detection of the artificial fault, in the indicative example of Cylinder 1 of the ME (This figure is available in colour online.).
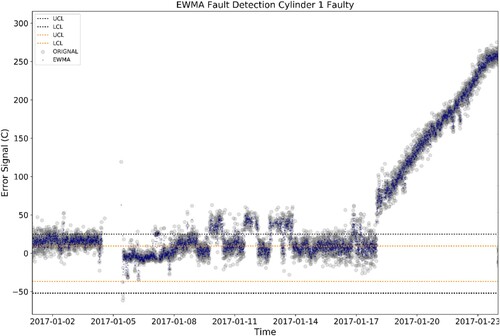
Table 2. Pairing between monitored variables and corresponding faults – fault mapping.
Figure 7. Sample diagnostic test for the fouling on the air-side of the AC (This figure is available in colour online.).
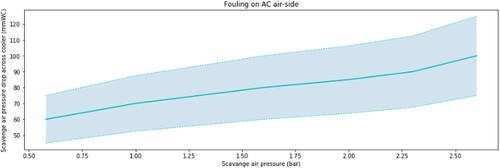
Figure 8. BN structure showing the entire ME system. Observable nodes are located on the top, followed by the control nodes, primary faults, secondary faults and test nodes (This figure is available in colour online.).
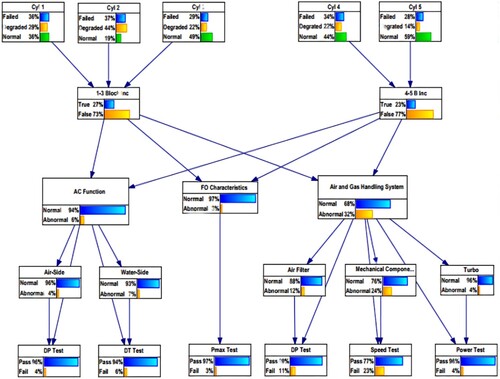
Figure 9. BN structure in the presence of fouling in the air-side of the AC (This figure is available in colour online.).
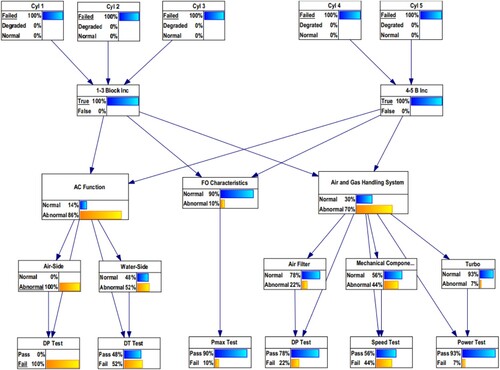
Figure 10. Fault profiles for the primary faults including all the failure modes (This figure is available in colour online.).
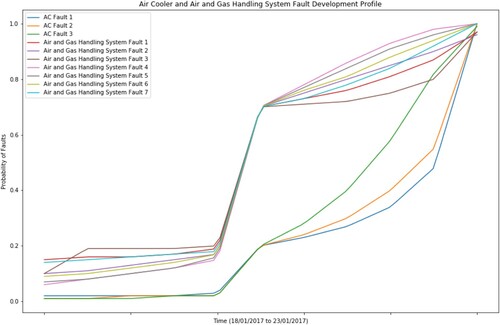
Figure 11. Fault profiles for the secondary faults (This figure is available in colour online.).
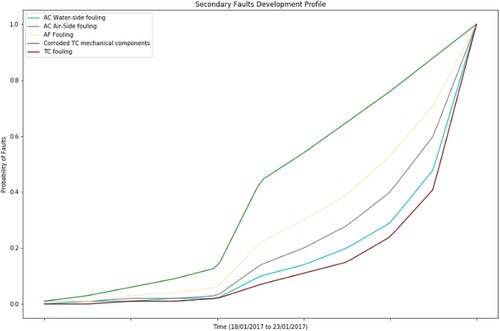
Table 3. Failure modes summary for the primary faults.