
Figures & data
Figure 1. Ship impact against a fixed (left) and a floating wind turbine (right). (This figure is available in colour online.)
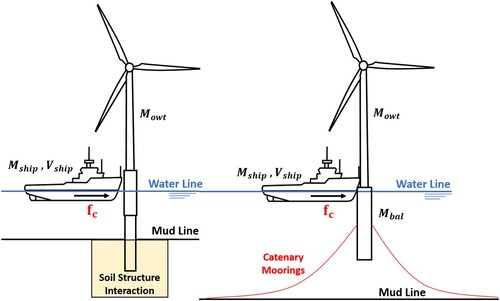
Figure 2. Analysis simplification in ship impacts against fixed (left) and floating (right) offshore wind turbines. (This figure is available in colour online.)
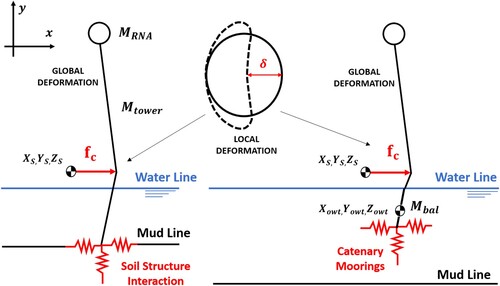
Figure 3. Examined FOWT and defined earth-fixed (O) and body-fixed (B) reference frames. (This figure is available in colour online.)
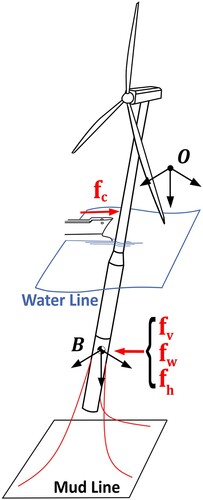
Figure 4. Soil idealisation by using non-linear Winkler foundations. (This figure is available in colour online.)
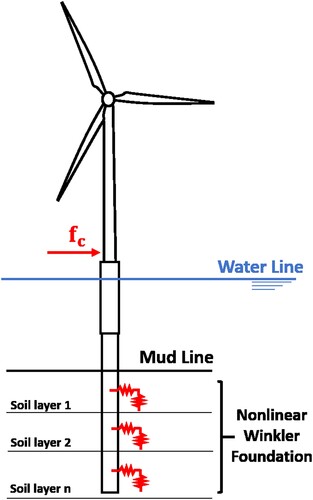
Figure 5. Floater and mooring types. (This figure is available in colour online.)
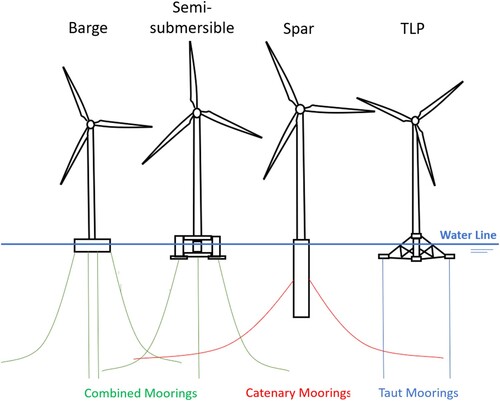
Figure 6. Interaction and validation of the results obtained by experimental testing and mathematical modelling of ship collision events. (This figure is available in colour online.)
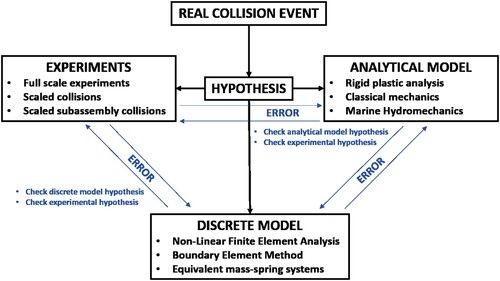
Figure 7. Simplified model of a collision between a flexible OWT and a supply vessel. Adapted from: Pedersen (Citation2013). (This figure is available in colour online.)
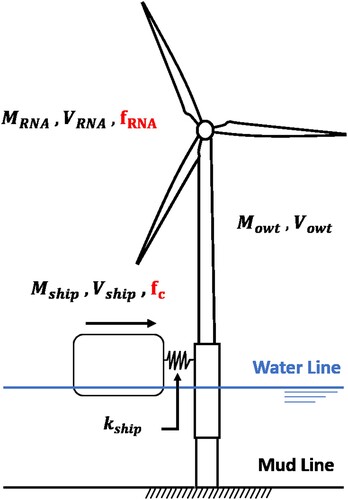
Figure 8. Effective plastic strain on the whole collided jacket. From: Pire (Citation2018). (This figure is available in colour online.)
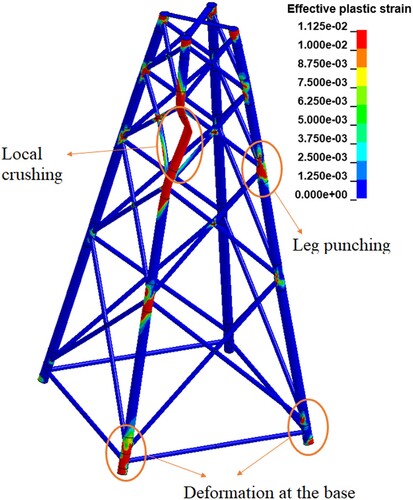
Figure 9. General algorithm including all deformation modes. Adapted from Pire (Citation2018).
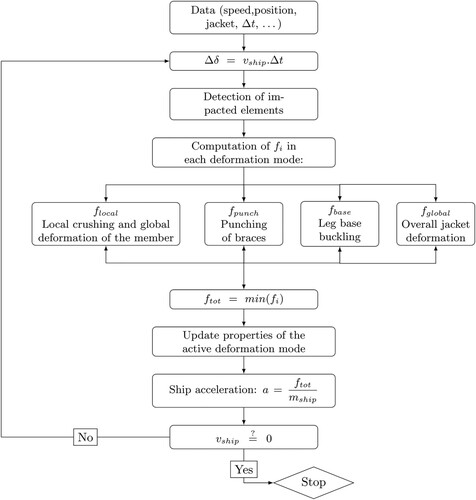
Figure 10. Global deformation of the monopile OWT for different impact velocities. From: Bela et al. (Citation2017). (This figure is available in colour online.)
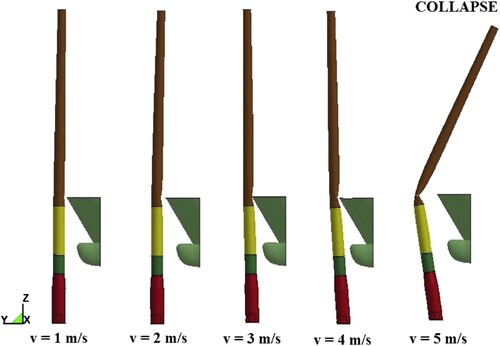
Figure 11. Deformation modes observed in a FOWT subjected to hip impact. From: Echeverry et al. (Citation2020). (This figure is available in colour online.)
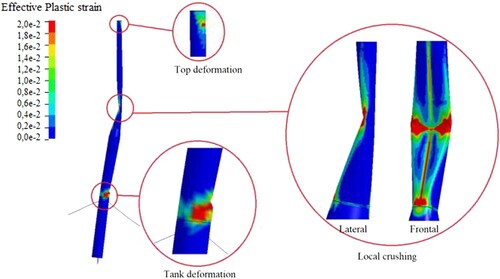
Figure 12. Engineering Stress–Strain curve for mild steel. (This figure is available in colour online.)
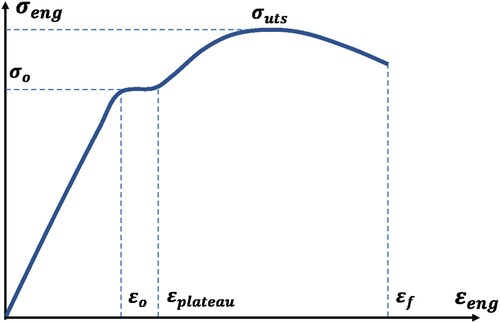
Figure 13. Punching cone in Reinforced Concrete elements. (This figure is available in colour online.)
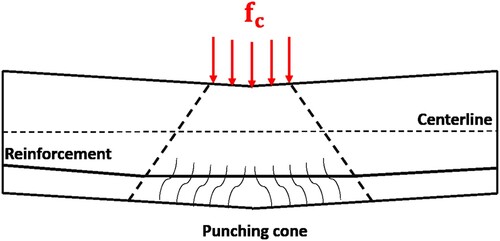
Figure 14. Ship collision scheme and damage contours obtained with different concrete materials for an impact energy of 0.09 MJ (2000 Ton OSV with an initial velocity of 0.3 m/s). From: Marquez et al. (Citation2021). (This figure is available in colour online.)
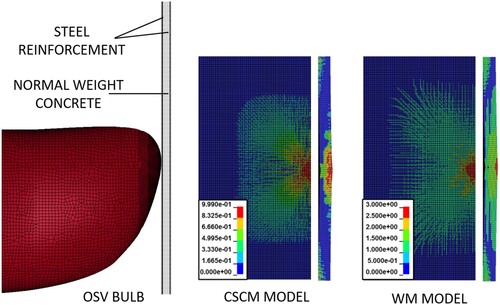
Table 1. Mooring modules feature comparison.