Figures & data
Table 1. The accident types for fishing vessels.
Figure 1. Position of KM, KG, and GM.
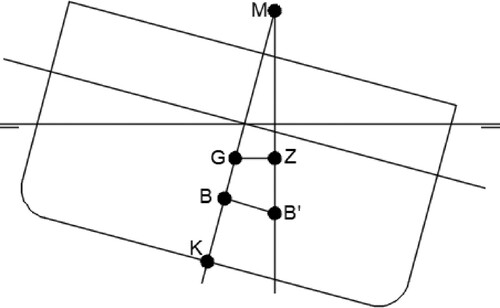
Figure 2. Coordinate system of the boat.
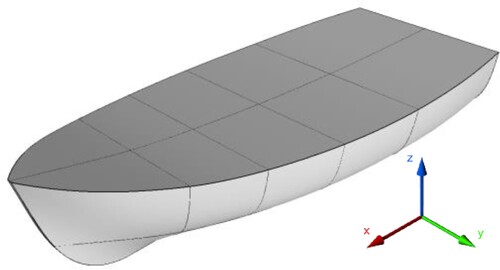
Figure 3. Overview of the operability analysis procedure.
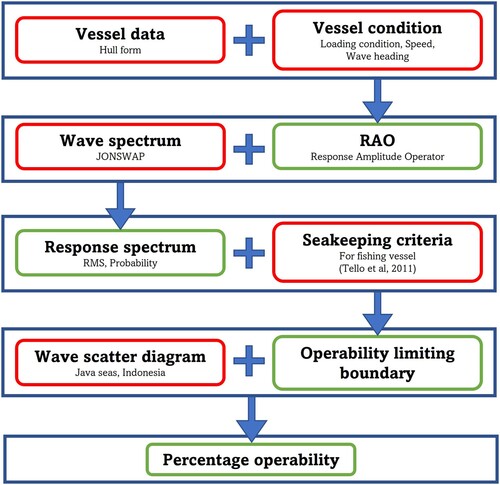
Figure 4. Body Plan of the Research Object (Liu et al. Citation2019).
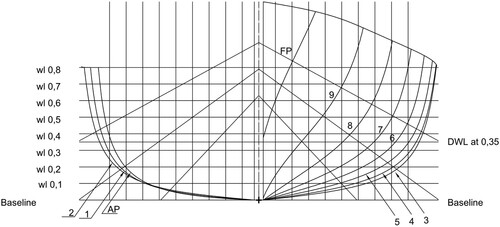
Table 2. Main Dimension of the Boat (Tezdogan et al. Citation2018).
Table 3. Load Scenario.
Table 4. Equilibrium Condition.
Figure 5. AVS and DFA of Load Case 1–5.
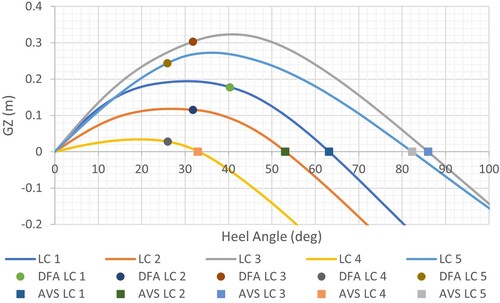
Table 5. AVS and DFA for Load Case 1–5.
Table 6. Seakeeping Criteria for Fishing Vessel (Tello et al. Citation2011).
Figure 6. Location of Wave Scatter (www.bing.com/maps).
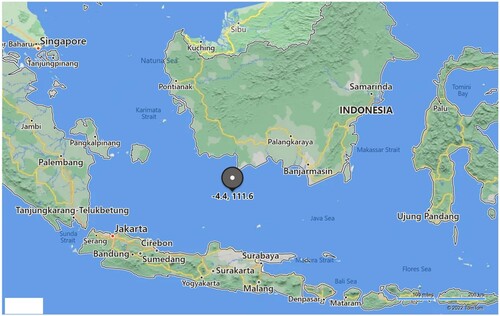
Table 7. Wave Scatter Diagram (https://app.metoceanview.com/hindcast/).
Figure 7. Definition of ORI for RMS Roll Motion (a), and Expected Maximum of Roll (b).
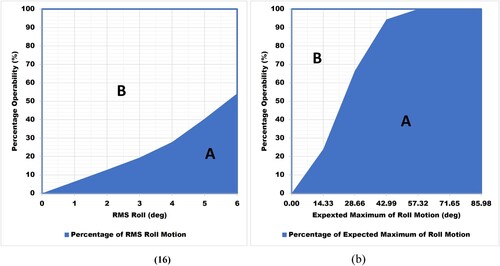
Figure 8. Heave RAO in Head Seas (0°) at 0 knot (a), 4 knot (b), and 8 knot (c).
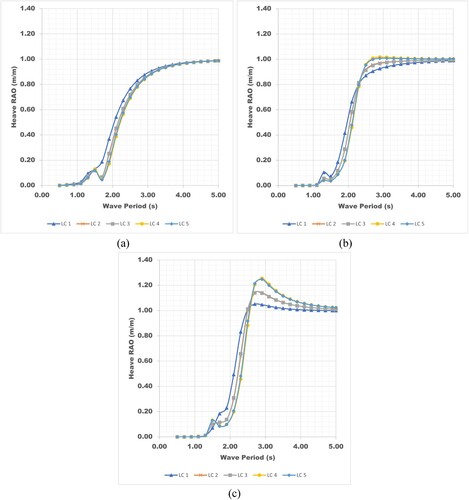
Figure 9. Pitch RAO in head seas (0°) at 0 knot (a), 4 knot (b), and 8 knot (c).
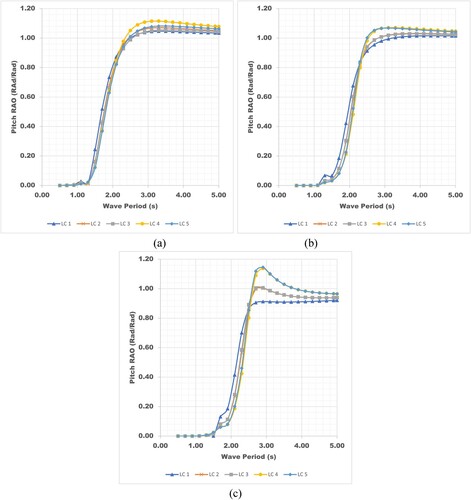
Figure 10. Roll RAO in Beam Seas (90°) in 0 knot (a), 4 knot (b), and 8 knot (c).
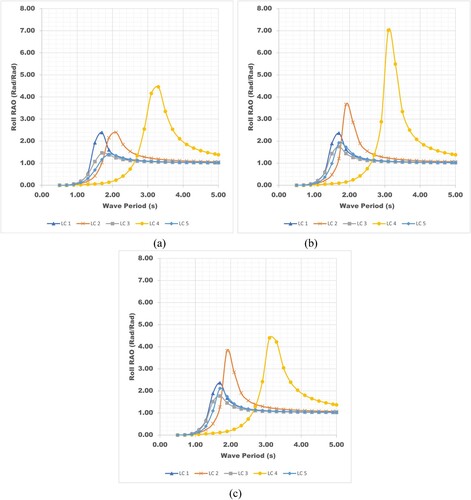
Figure 11. Ratio KG and GM to KM.
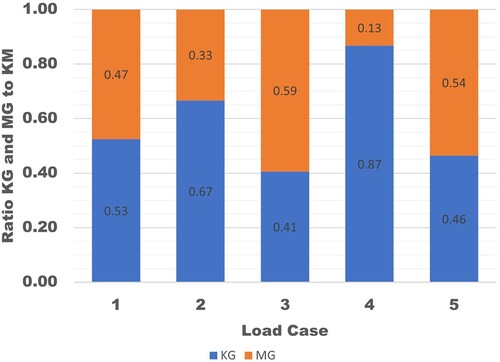
Figure 12. Operability limiting boundary in wave heading 60°, at 8 knots for Load Case 1 (a), Load Case 2 (b), Load Case 3 (c), Load Case 4 (d), Load Case 5 (e).
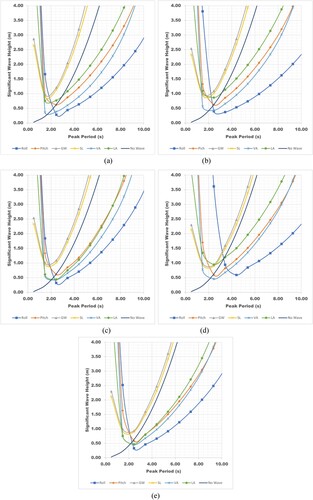
Figure 13. Percentage Operability for Criterion 1 and Criterion 2.
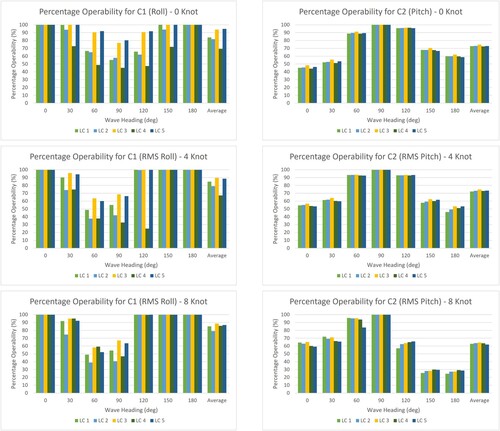
Figure 14. Percentage Operability for Criteria 3 and Criteria 4.
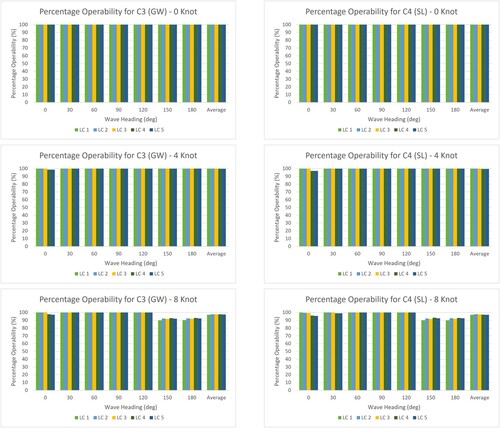
Figure 15. Percentage Operability for Criteria 5 and Criteria 6.
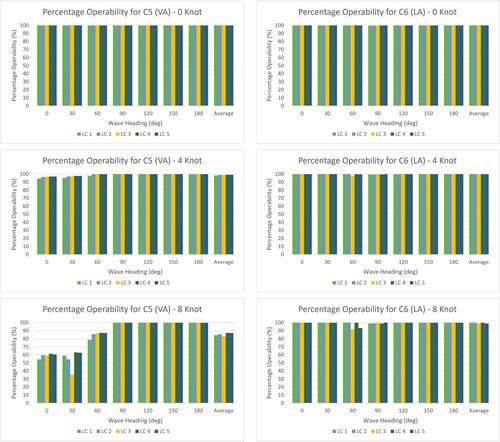
Figure 16. Percentage Operability for All Criteria.
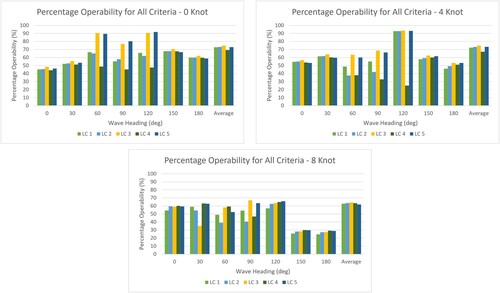
Figure 17. Percentage Operability for Expected Maximum of Roll with a different limiting angle.
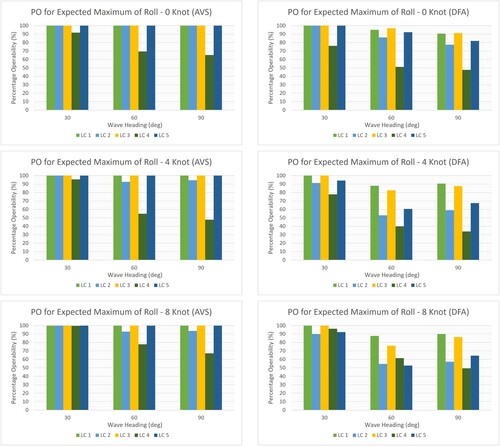
Figure 18. Operability Robustness Index (ORI) Value for RMS Roll Motion.
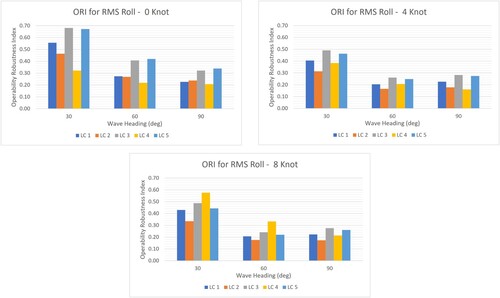
Figure 19. Operability Robustness Index (ORI) Value for Expected Maximum Roll Motion with different maximum limiting angle.
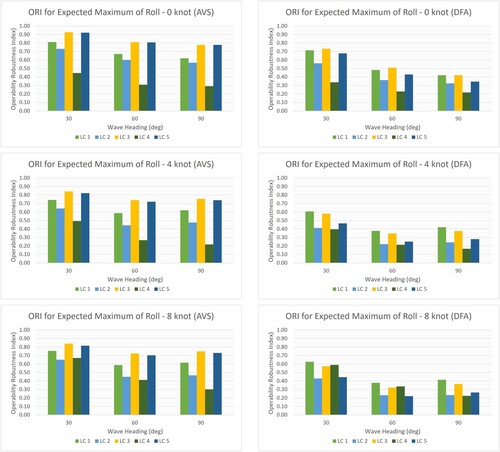
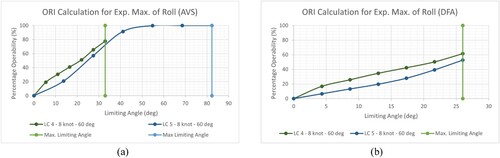
Figure 20. ORI calculation for same load case with different maximum limiting angle (AVS and DFA).