Figures & data
Figure 1. (A) Landsat ETM+ (band composite 742) showing moraine ridges and plateaus affected by permafrost degradation in NW Russia. (B) VFP shaded relief image of the same area showing moraine ridges more clearly. The shaded relief colour table is stretched to optimize moraine landform detection. Total relief in the image is about 100 m. Black arrows shows moraine lobes in both A and B.
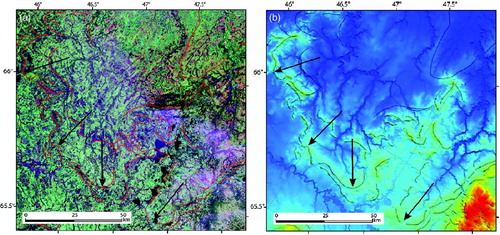
Figure 2. Moraine ridges and complex moraine zones (black lines on moraine crests) on the Taymyr Peninsula reflecting the past extent of the Kara Sea and Byrranga Mountains ice sheets. The moraines are hundreds of kilometres long and about 100 m high.
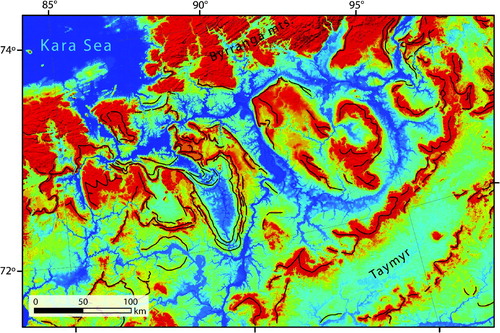
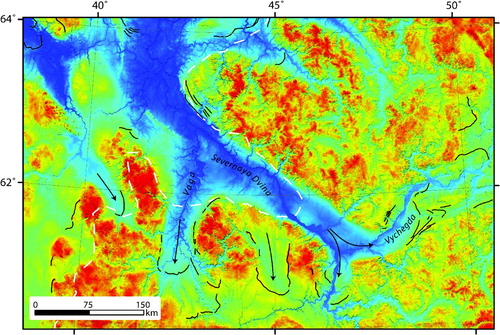
Figure 3. Comparison between previously published ice extent (white stippled line) (CitationLarsen et al., 2006, p. 31), and mapped end moraines in this study (black lines) in the Severnaya Dvina area. Arrows indicates inferred LGM ice movement. Total relief in the image is about 250 m and moraines are typically 20–50 m high.