Figures & data
Figure 1. One hundred and eighty degree panorama image of the lower part of the proglacial zone at the Obersulzbachkees landsystem with the summit of the Großer Geiger in the background. The moraine ridge at the margins marks the advance of the Obersulzbachkees in response to the cooler period of the 1920s with the maximum reached ca. 1927 (CitationSlupetzky, 1986). The terrain is impressed by a typical glacial trough morphology with an up to 350 m wide trough bottom delimited by steep rock walls. In the direction of view, a distinct bedrock step of ca. 130 m builds the transition to the present day glacier areas (view to south, 26.07.2011).
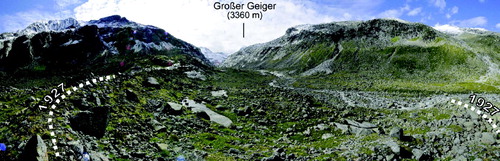
Figure 2. One hundred and eighty degree panorama image of the Pasterze landsystem with the summits of the Großglockner, Johannisberg and the Fuscher-Kar-Kopf in the background and Pasterze glacier with a subsequent sandur in the centre (view to north-west, 02.08.2011).
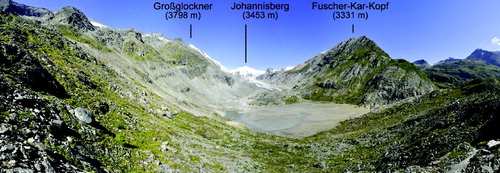
Figure 3. Hypsometry of the Obersulzbachkees (a) and the Pasterze Glacier (b) landsystem. The real surface area of classified slope gradients is given in colours according to the supplementary slope maps and the sum of all slope classes per unit contour interval represents the real surface area of the contour interval. Plots d and e show the ratio between the real surface area (Ar) and planimetric area (i.e. horizontally projected, Ap) per unit contour interval and illustrate the importance of real surface area calculations. A comparison of both landsystems by normalized hypsometric curves of the real surface area is given in addition (c). See text for additional descriptions.
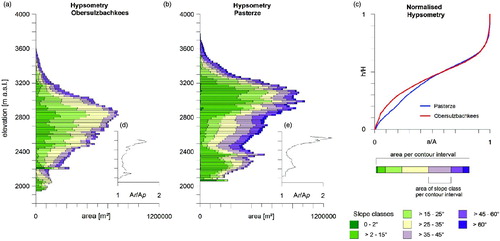
Figure 4. Quantitative analyses and hypsometric distribution of glaciers, bedrock and sediment storage types at the Obersulzbachkees landsystem given in two levels of detail (LOD). LOD 1 provides a general overview of bedrock exposures, debris covered and clean ice glacier areas and total sediment coverage at the landsystem scale (plot a). LOD 2 depicts the total sediment coverage of LOD 1 in detail and gives the absolute coverage of sediment storages types and their relative contributions to the landsystem area covered by sediment (plot b). The coverage of storage types at the landsystem scale is additionally marked in brackets. See text for additional descriptions.
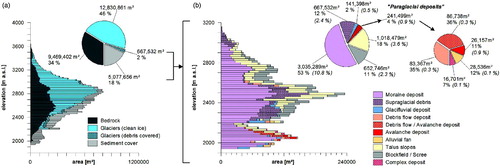
Figure 5. (a) Partly snow covered block field in the vicinity of the Kürsinger Hütte (view to south, 16.08.2009); (b) meltwater channel eroding an esker with large boulders dumped on top in the forefield area of the Venediger and Sulzbachkees (view to south, 16.08.2009); (c) paraglacial reworking and till slope modification at the Venedigerkees (view to south-west, 15.08.2009); (d) the proglacial lake in front of the Obersulzbachkees with a till slope incised by debris flows (view to north, 17.08.2009); (e) glacifluvial outwash sands at an ice proximal location of the Obersulzbachkees (view to south, 17.08.2009); (f) the western slope of the main valley with the Obersulzbach stream, moraine deposits in the valley floor are completely vegetated and active reworking by debris flows, avalanches and linear erosion along the tributaries is indicated by fresh deposit surfaces on the slope, sediment is transferred into the valley floor but hillslope-channel coupling is not observed (view to west, 18.08.2009); (g) gully incised till slope with subsequent coalescing debris cones (view to south-west, 18.08.2009); (h) lower part of the main valley floor with the Obersulzbach stream being the dominant path of sediment output, note the vegetated and stable channel banks (view to north-east, 18.08.2009).
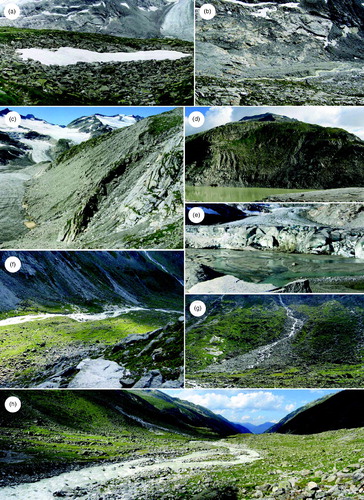
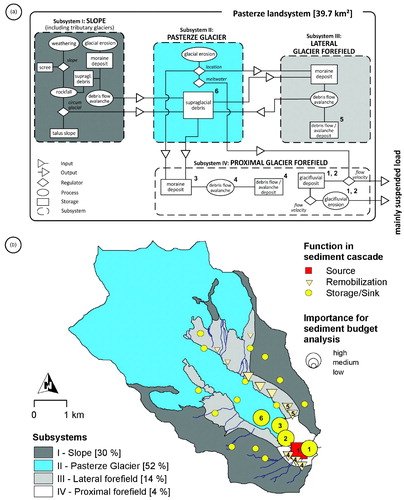
Figure 6. Conceptual sediment cascade model of the Obersulzbachkees landsystem (a), please note that the number of processes within the sediment cascade has been reduced to the most dominant. Location and dimension of subsystems with the spatial distribution of sediment storage units classified according to the function within the sediment cascade (b). The relative importance of these units in the ongoing sediment budget analysis was estimated qualitatively and the most important zones are numbered in both plots. See text for additional descriptions.
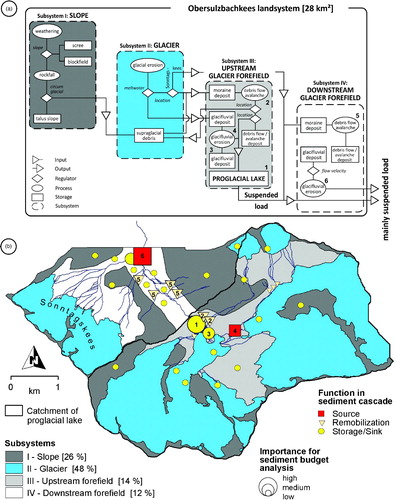
Figure 7. Quantitative landsystem analyses and sediment storage distribution at the Pasterze area given in two levels of detail (LOD 1 & 2, figure structure is equal to ). Additional descriptions are given in the text.
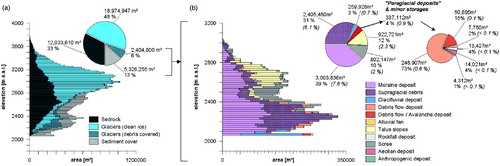
Figure 8. (a) The ‘Little Ice Age’ moraine ridge at the Wasserfallwinkel (view to east, 11.09.2009); (b) fined grained scree with a high sand content originating from the mechanical breakdown of calcareous mica-schist at the lower limit of the Gamsgrube (12.09.2009); (c) scree and bound solifluction in the vicinity of the Hofmanns Hütte (11.09.2009); (d) ice marginal reworking of moraine deposits exposing former till covered bedrock (view to north-east, 13.09.2009); (e) smooth and platy bedrock outcrops of calcareous mica-schist (so called ‘Bratschen’) at the orographic left slope of the Pasterze with intensive reworking of moraine deposits, the maximum ‘Little Ice Age’ extent of the Pasterze is indicated by the intersected vegetation cover (view to north-east, 13.09.2009); (f) proximal forefield area including the lower limit of the Pasterze with the pronounced supraglacial debris cover, the central part shows glacial outwash sands limited by hummocky terrain with melting dead ice bodies and kettle holes, note the change in water colour (view to south-west, 22.09.2009); (g) debris flow and avalanche tracks incising the lateral moraine and the till mantled slope in the lower forefield area, the intersected vegetation cover indicates the LIA limit (view to south-west, 10.09.2009).
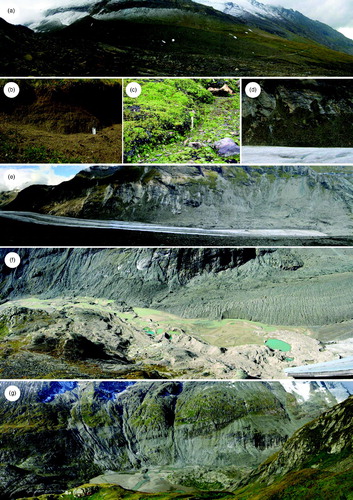
Figure 9. Conceptual sediment cascade model (a) and subsystem map (b) of the Pasterze landsystem (figure structure is equal to , please note that the spatial coverage of the Pasterze Glacier subsystem differs from the glacial coverage at the landsystem scale () because the tributary glaciers are incorporated in the subsystem slope). See text for additional descriptions.