Figures & data
Figure 1. Geographical and regional geological schematic map of Kloštar Field (modified from CitationVelić, Citation2007).
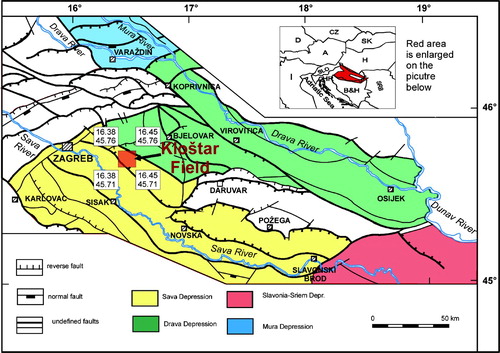
Figure 2. Formal lithostratigraphic and chronostratigraphic units, E-log markers/border, and absolute ages in the Sava Depression.
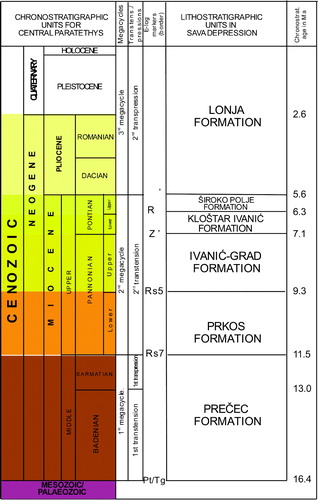
Table 1. Interpolated palaeostructural maps in the Kloštar Field (grey are maps given in CitationVelić et al., 2011; orange are maps given in this paper).
Supplemental material