Figures & data
Figure 1. (a) Schematic structural map of Italy; the study area is in the dotted red box; (b) geological features of the southern sector of the Bradanic Trough in which the study area is located; (c) SIC area ‘Bosco Pantano di Policoro e Costa Ionica Foce Sinni’.
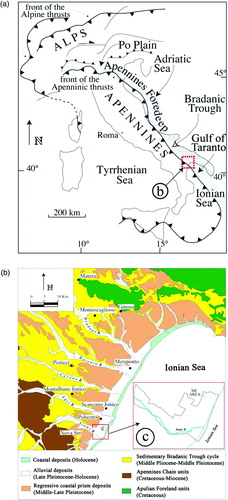
Figure 2. Azimuthal diagram showing wind directions as a function of velocity. Wind data were collected over the last 10 years in an anemometric station located about 15 km North of the study area.
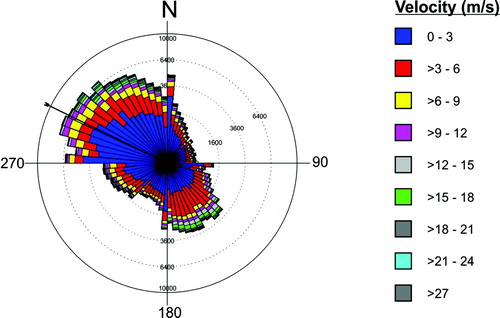
Figure 3. Pie charts showing petrographic compositions of sediments in different sub-environments of the study area coastal system.
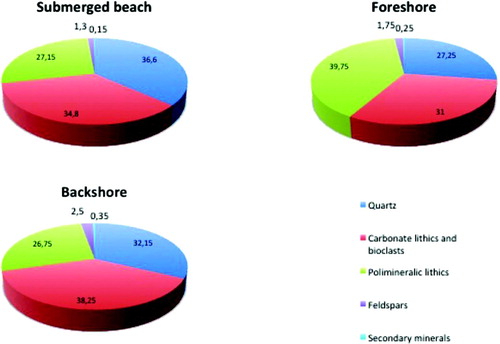
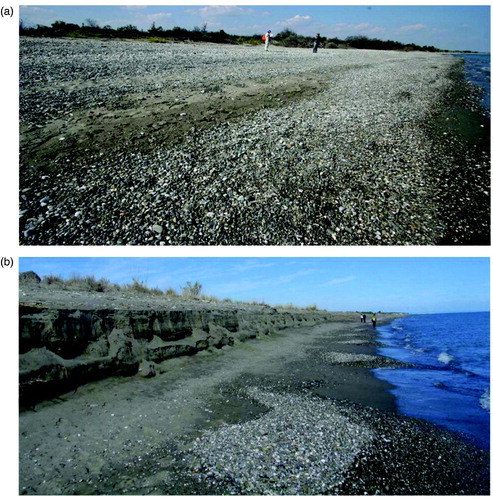
Figure 4. Morphology of a stretch of beach, North of the Sinni River mouth in September (a) and in December (b) 2010. Note the clear storm berm developed during winter 2010.