Figures & data
Figure 1. Location map of the study area showing the main tectonic lineaments, overlapped onto a 20 m DEM hillshade. Numbers refer to fault segments: (1) Cittanova; (2) Serre; (3) Reggio Calabria; (4) Capo Vaticano; (5) Nicotera; (6) Scilla; (7) S. Eufemia; (8) Messina-Taormina. Faults are redrawn from Monaco and Tortorici (Citation2000).
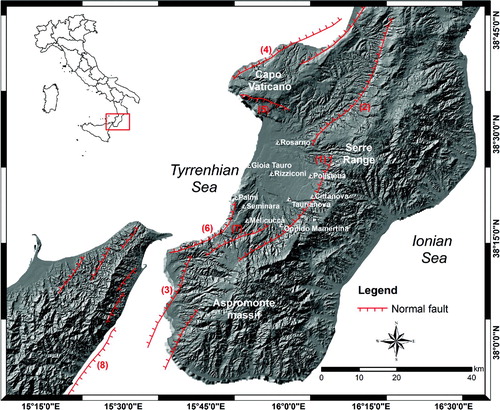
Figure 2. Geological map (1:25,000 scale) of the Gioia Tauro Plain (modified from AA.VV., Citation1958–1962).
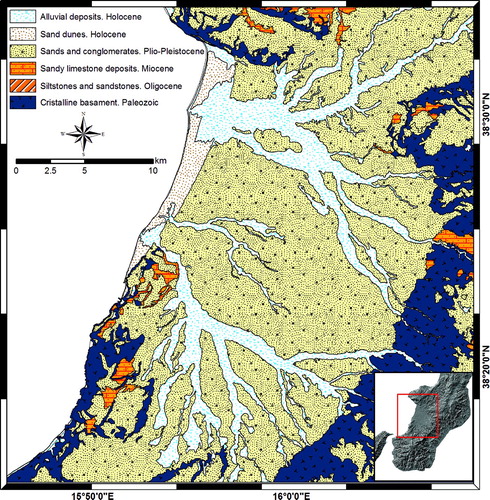
Figure 3. Input PSI data available for the Gioia Tauro Plain: (a) ERS1/2 ascending (1992–2000); (b) ERS1/2 descending (1992–2001); (c) ENVISAT ascending (2002–2006); (d) ENVISAT descending (2003–2006). PSI data overlap onto a 20 m DEM hillshade and digital ortophoto from Volo ITALIA 2000. A 50% transparency has been set on the ortophoto layer.
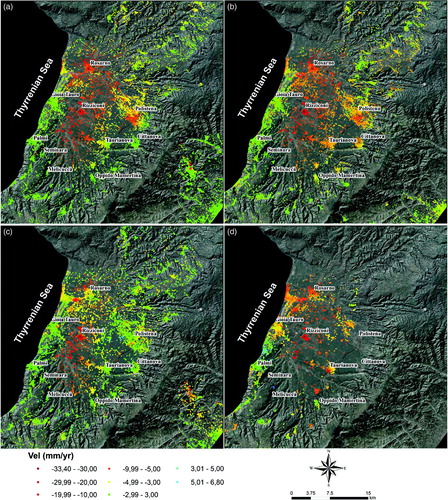
Figure 4. Flow chart of the methodology used.
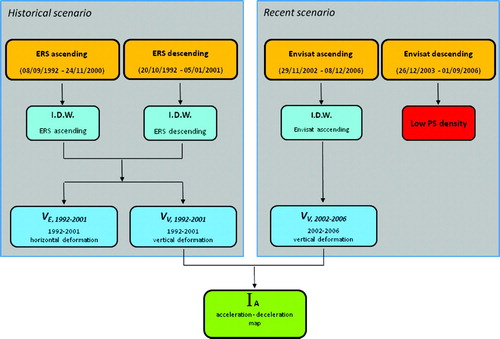
Figure 5. Extraction of vertical and horizontal (E-W) deformation component for ERS (left) and Envisat dataset (right).
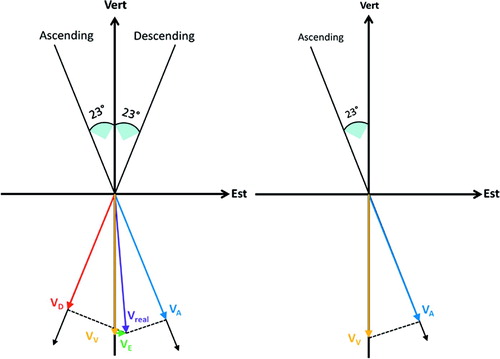
Figure 6. (a) ERS vertical component; (b) Envisat vertical component; (c) ERS horizontal (E-W) component.
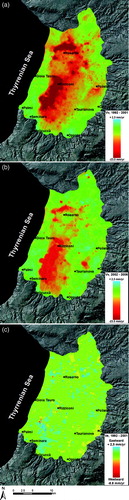
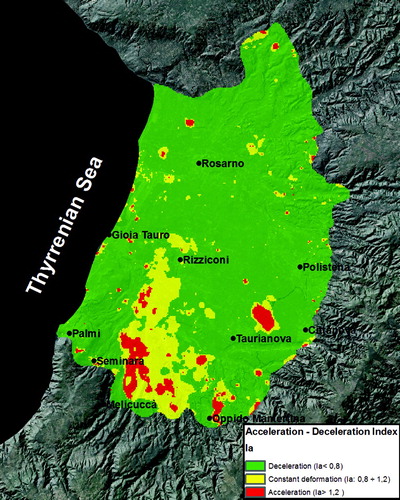
Figure 7. Acceleration-deceleration Index map.