Figures & data
Table 2. USGS Landsat images used to reconstruct recent fire history of selected years (number and dates of images used) and the duration in days between the first and last image used for modelling the errors.
Table 3. Number of fires and area burned as estimated from USGS Landsat images and as recorded from the Hellenic Forest Service together with their differences (error).
Table 1. Accuracy report of the classification results for the Mt. Parnitha study site.
Table 4. Regression models of the differences in area burned against the first and last date of the Landsat images used within each year (Julian date), the number of images and the duration (last – first Julian date).
Table 5. Regression models of the differences in number of fires against the first and last date of the Landsat images used within each year (Julian date), the number of images and the duration (last – first Julian date).
Figure 1. Scatter plots between differences in area burned (estimated from USGS Landsat images – recorded from the Hellenic Forest Service) and independent variables used to model the errors (number of images, date of first and last image, duration in days between first and last image).
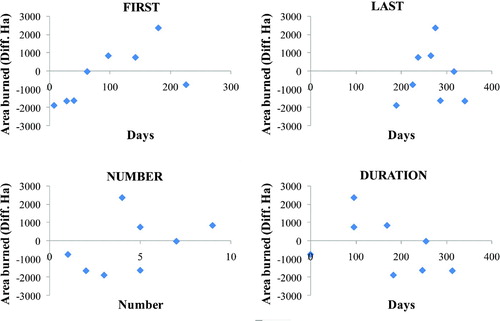
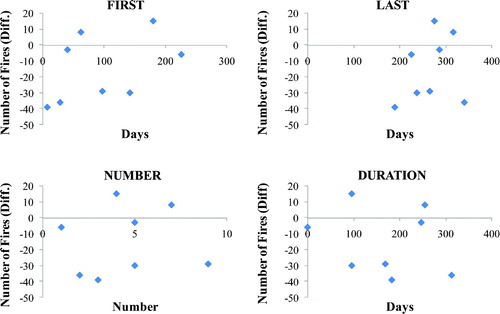
Figure 2. Scatter plots between differences in number of fires (estimated from USGS Landsat images – recorded from the Hellenic Forest Service) and independent variables used to model the errors (number of images, date of first and last image, duration in days between first and last image).
Supplemental material