Figures & data
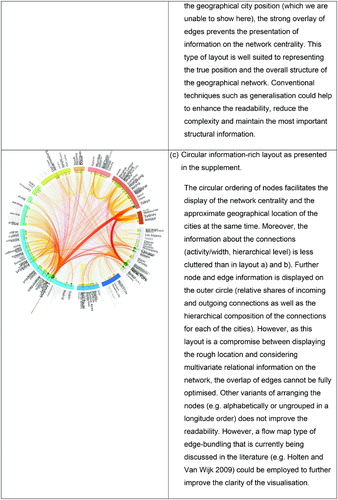
Figure 2. Example of a projected two-mode network into a one-mode network that contains the cities that are linked through common firms.
Figure 3. Basic structure of the information-rich circular layout for spatial network data.
Supplemental material