Figures & data
Figure 1. Workflow for population map production and validation.
Table 1. Disaggregation approaches used in this study.
Table 2. Strata definition, R 2 and obtained coefficients for each regression.
Figure 2. Population distribution in Greater Lisbon, Portugal. Results for each dasymetric approach. Pixel size: 100 × 100 meters.
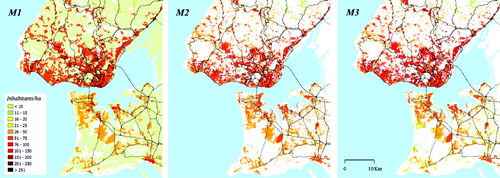
Figure 3. Results of validation by commune size expressed as RTAE∈[0,2].
![Figure 3. Results of validation by commune size expressed as RTAE∈[0,2].](/cms/asset/cfd10375-eaea-44fd-b0a0-88c8da288046/tjom_a_764830_f0003.jpg)
Table 3. Results of validation by country expressed as RTAE [0,2].
Table 4. Results of validation of the final population grid, by country, expressed as RTAE∈[0,2].
Supplemental material