Figures & data
Figure 1. Maps of population: A. Map of population by proportional symbols; B. Population density map; C. Map of population potential.
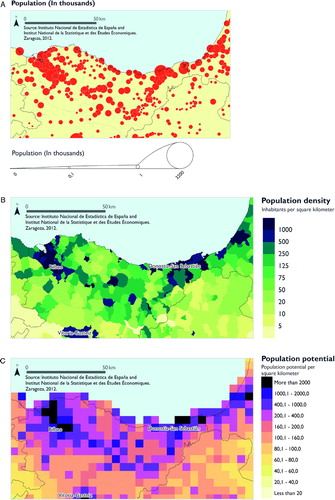
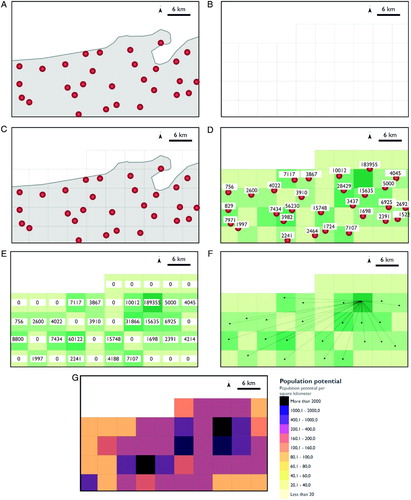
Figure 2. Calculation process of population potential: A. Municipalities with population data. B. The 5 × 5 km matrix. C. Raster matrix overlaps the municipal layer. D. Assignation of each municipal population to a cell in the matrix. E. Population values are assigned to each cell. F. Calculating population potential. G. Final map of population potential.
Supplemental material