Figures & data
Figure 1. The Montaguto earth flow on 27 April 2006. Photo taken from a helicopter looking south toward the earth-flow toe.
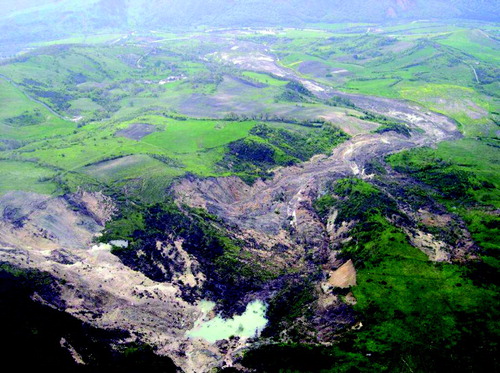
Table 1. Data used for base maps.
Figure 2. Back-tilted surface on the body of the earth flow with a small pond (about 7-m wide) located in the depression formed by back-tilting. Arrow shows the direction of back-tilting. Movement of the earth flow is from left to right.
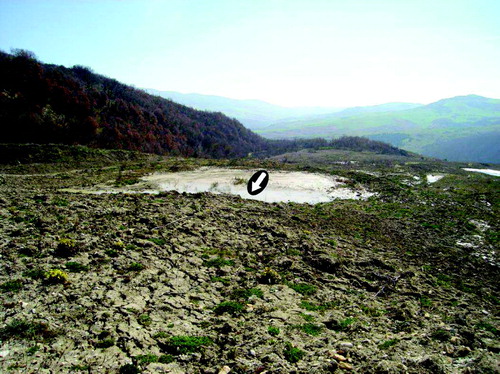
Figure 3. Thrust fault in the earth-flow source area. Linework shows the position of the mapped thrust fault. Thrust fault is about 100-m long at this location.
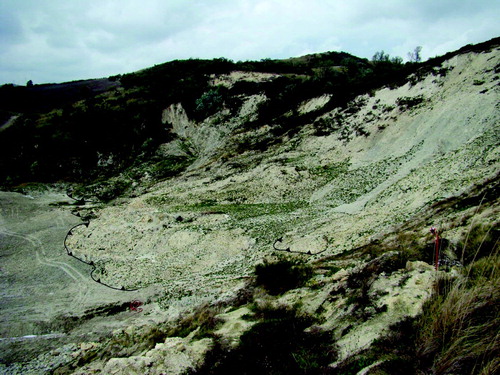
Figure 4. Flank ridge in the middle part of the source area of the earth flow. Linework shows the topographic crest of the ridge. Distance across the photo from left to right is about 150 m.
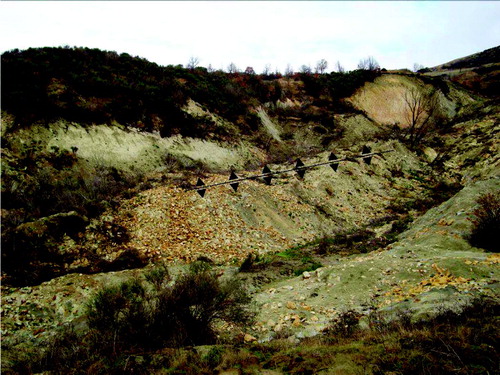
Figure 5. Normal faults at the head of the earth flow. Linework connects points along the top of the scarp. Height of the prominent scarp at the upper right is about 2 m.
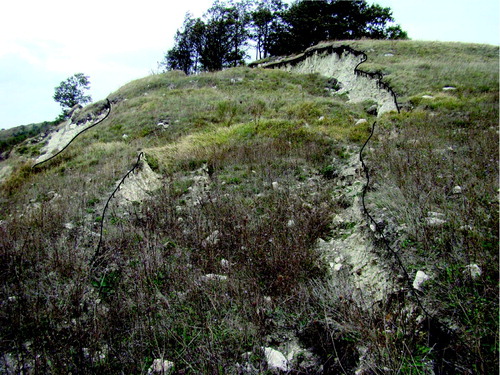
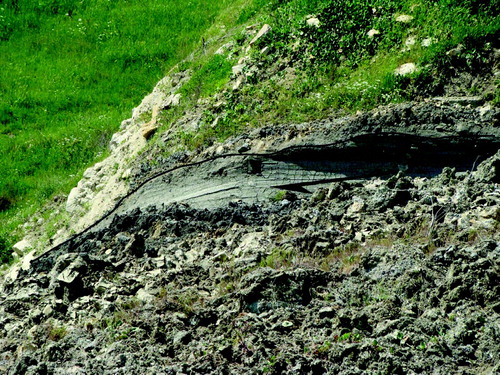
Figure 6. Strike-slip fault along the body of the earth flow. Slickensides and arrow show movement direction. Distance from left to right across the photo is about 4 m.