Figures & data
Figure 1. Choropleth map of Percent of Population who are White Alone, taken from the US Census Bureau American FactFinder web mapping tool. Counties with diagonal lines have values that are statistically indistinguishable from the user selected county, shown with a red pushpin.
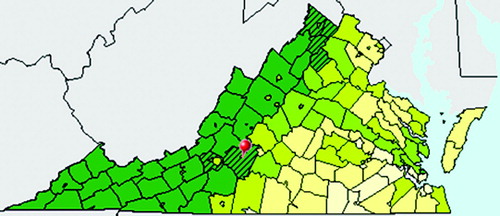
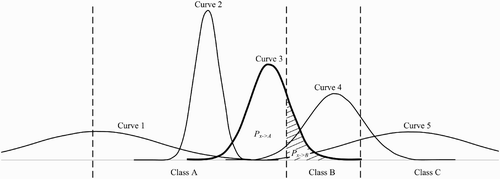
Figure 2. Illustration of probabilities used to define separability index. See text for details.
Supplemental material