Figures & data
Figure 1. Location of the study area.
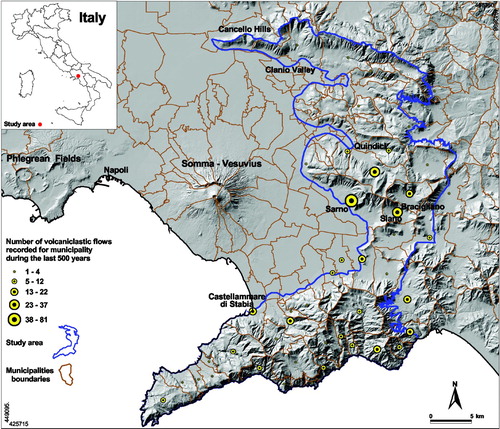
Table 1. A portion of the drainage basins database.
Table 2. Classes of disruption proneness defined for each drainage basin (SL = slope, BSF = basin shape factor).
Figure 2. (a) Classes of topography expressed as a % of the total study area: 1 – Green areas are relatively flat, potentially vulnerable to debris flow inundation; 2 – Pink areas have slope >15° that were amenable to classification in basins; 3 – Drainage Basins; 4 – Others areas, slope <15° that were not classified into basins. (b) Distribution of drainage basins according to disruption proneness classes, as shown on the hazard map. See for explanation of classes.
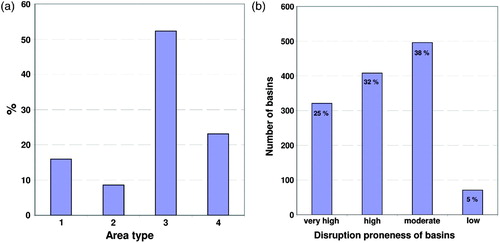
Figure 3. Examples of basin shapes in Sarno-Quindici-Siano-Bracigliano region. Basin-shape factor (BSF) is defined as ratio of upper area of basin (Au) to lower area (Al); boundary between these two areas is at location of average height [hm = (hmax + hmin)/2] of basin. The figure is modified after CitationPareschi et al., 2000.
![Figure 3. Examples of basin shapes in Sarno-Quindici-Siano-Bracigliano region. Basin-shape factor (BSF) is defined as ratio of upper area of basin (Au) to lower area (Al); boundary between these two areas is at location of average height [hm = (hmax + hmin)/2] of basin. The figure is modified after CitationPareschi et al., 2000.](/cms/asset/24af2e8e-c9f5-4f47-89b6-2a20c0f32bf0/tjom_a_768948_o_f0003g.gif)