2,218
Views
5
CrossRef citations to date
0
Altmetric
SOCIAL SCIENCE: Second part of special issue on spatial demography

Demographic sustainability and rural development policy

Pages 154-160 | Received 26 Mar 2012, Accepted 03 Feb 2013, Published online: 22 Feb 2013

Figures & data

Figure 1. Demographic structure and its stages of development.

Figure 1. Demographic structure and its stages of development.

Figure 2. Evaluation matrix of environmental sensitivity to development. The darker the color, the higher is the sensitivity to development.

Figure 2. Evaluation matrix of environmental sensitivity to development. The darker the color, the higher is the sensitivity to development.

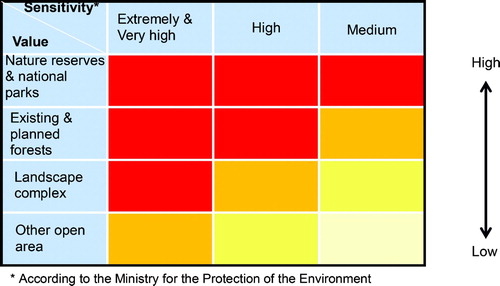
Table 1. Distribution of the Galilee settlements by type and demographic structure.

Table 2. Distribution of the Galilee settlements by type and the need (aggregated score) for policy and development intervention.

Supplemental material

Main Map: Demographic Sustainability and Rural Development Policy

Download PDF (1.3 MB)

Reprints and Corporate Permissions

Please note: Selecting permissions does not provide access to the full text of the article, please see our help page How do I view content?

To request a reprint or corporate permissions for this article, please click on the relevant link below:

Academic Permissions

Please note: Selecting permissions does not provide access to the full text of the article, please see our help page How do I view content?

Obtain permissions instantly via Rightslink by clicking on the button below:

If you are unable to obtain permissions via Rightslink, please complete and submit this Permissions form. For more information, please visit our Permissions help page.