Figures & data
Figure 1. Sydney urban extent, 1981 and 2006 and current local authority boundaries.
Table 1. Variables used for regionalisation analysis.
Figure 2. Seven broad HMsAs intersecting urban Sydney.
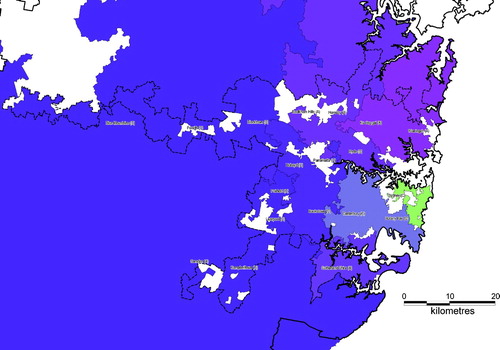
Figure 3. Legend and example colour profiles achieved using RGB mapping.
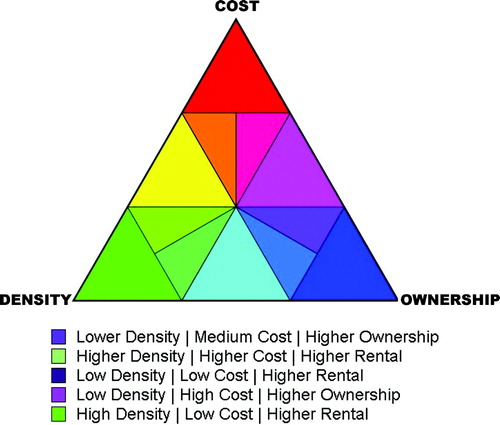
Figure 4. HMdA geography.
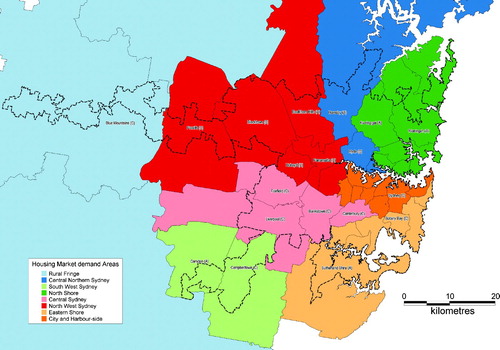
Table 2. Movement within and between HMdA and HMsA (SLA composite) as percentage of total.
Table 3. Main flows and contextualised HMsA profiles.
Supplemental material