Figures & data
Figure 1. (a) DTM of Pozzuoli Bay. Projection is UTM (33); Datum is WGS84. (Lakes: AL = Averno, LL = Lucrino; Craters: MN = Monte Nuovo, GA = Gauro; AS = Astroni; CI = Cigliano; SO = Solfatara; AG = Agnano; AS = Astroni); Inset (b) Archaeological remains in the marine sector in front of Baia (VdP = Villa dei Pisoni; BeC = Baianus Lacus entry channel); Inset (c) Archaeological remains in the marine sector in front of Pozzuoli (PI = Portus Iulius; PIEC = Portus Iulius Entry Channel).
Figure 2. (a) Slope map; (b) Aspect map; (c) Seafloor DEM sample displaying apparent rugged-shaped, ripple-like morphology, actually due to an artefact (fake seafloor undulations aligned along swath, perpendicular to the ship heading); (d) bathymetric profile P1–P2 showing shape and magnitude of ripple-like noise.
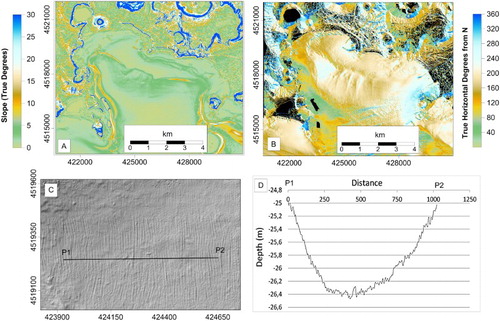
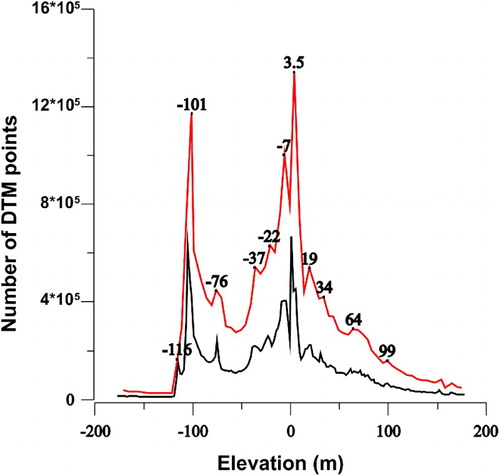
Figure 3. Elevation histogram derived from the DTM data, illustrating statistical distribution and average elevation of planar (terraced) surfaces. Red line indicates the envelope of grid cell elevations computed at 1 m; black line shows the same distribution computed at 3 m.