
Figures & data
Table 1. Evolution of the population and urban land in Madrid Region (2000-2006-2009).
Table 2. LULC categories of Madrid land use.
Figure 1. Location of Madrid region.
Figure 2. Characteristics of the MLU maps (level 2).
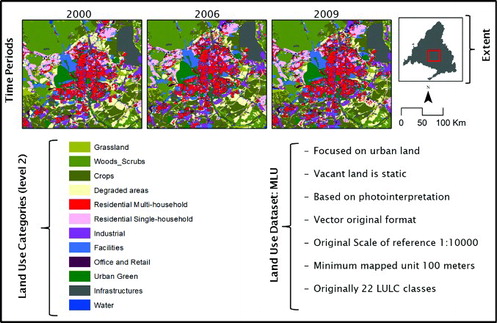
Figure 3. Procedure for land use data capture from orthophotos.
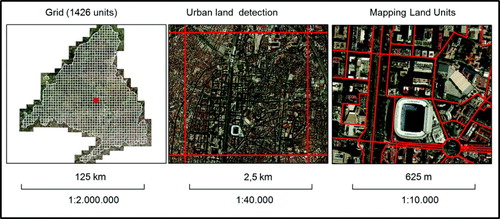
Figure 4. Support to urban land use classification.
Sources: Madrid Government, Spanish Cadastre, Bing maps, Google maps.
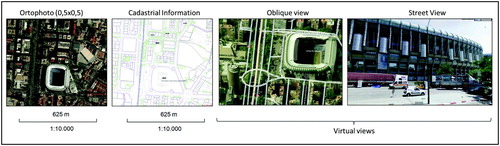
Figure 5. Land use units overlapping census tract units.
Source: MLU, Institute of Statistics of Madrid A.C.
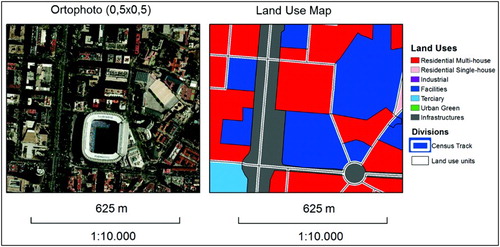
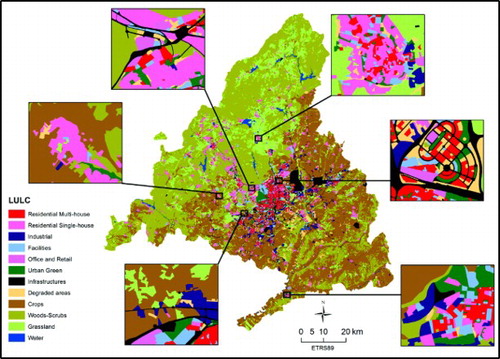
Figure 6. Sample of final composition and details at 1:50.000 of MLU (2009).
Source: MLU.
Supplemental material