Figures & data
Figure 1. Topographic sketch of the province of Siena, with red wines DOC (ORC, Orcia; GRS, Grance senesi; CAS, Terre di Casole) and DOCG areas (BRU, Brunello di Montalcino; NOB, Nobile di Montepulciano; ChS, Chianti and Chianti Colli Senesi; ChC, Chianti Classico). The area of Chianti Colli Senesi DOCG included the areas of Brunello di Montalcino DOCG and a large part of the Nobile di Montepulciano DOCG.
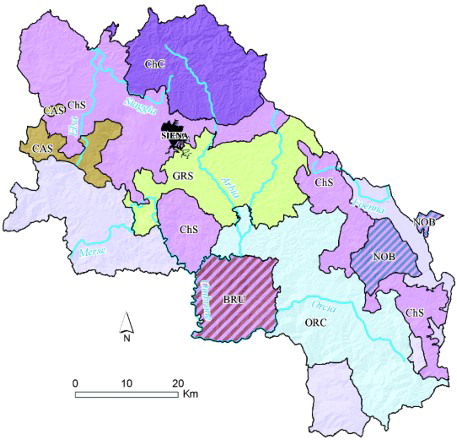
Figure 2. Soil regions and sub-regions of the province of Siena (Costantini et al., Citation2013, modified).
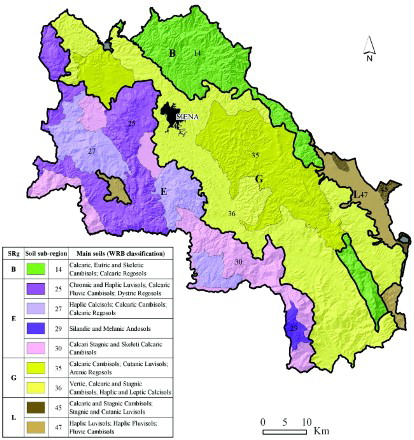
Table 1. Descriptive statistics of the experimental vineyards (n = 55).
Table 2. Exploratory PCA factor loadings and explained variance. The factor loadings positive and >0.5 are highlighted in dark grey, the negative <−0.5 in pale grey.
Figure 3. Maps of the pedological variables used for the NTU mapping. Each map showed the interpolation method (MSCLM, Multicollocated Simple Cokriging with varying Local Means; SKLM, Simple Kriging with varying Local Mean; RK, Regression Kriging) and the errors (ME, Mean error and MSSE, Mean Standardize Squared Error).
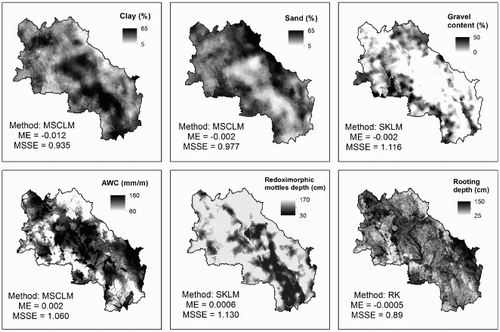
Figure 4. Maps used for the k-means clustering to obtain the Natural Terroirs Units (NTU) map of the province of Siena.
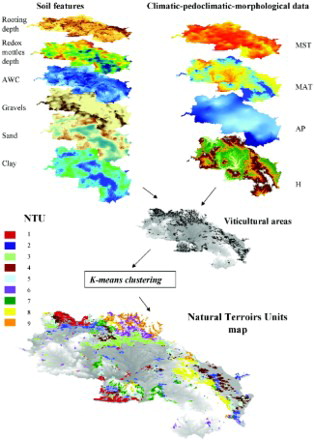
Figure 5. Mean values of the variables used for the clustering in each NTU.
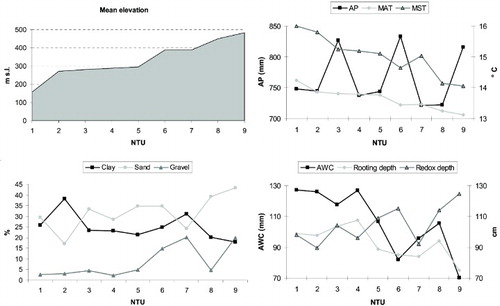
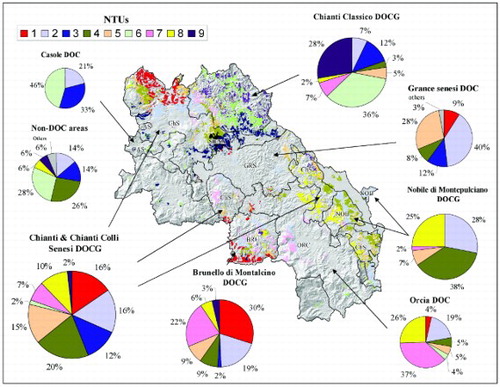
Figure 6. Distribution in percentage of the NTUs in the main DOC and DOCG of the province of Siena. The dark grey polygons of the map show the viticultural areas. The area of Chianti & Chianti Colli Senesi includes the area of Brunello di Montalcino and Nobile di Montepulciano.