Figures & data
Figure 1. Geological sketch map of Ischia Island (CitationOrsi et al., 2003, modified). Location of the study area in the inset.
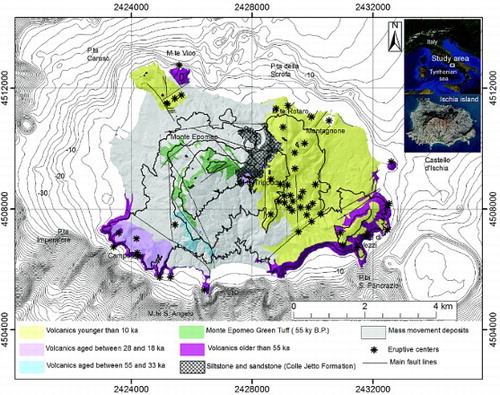
Figure 2. Volcanic hazard map of Ischia Island (CitationAlberico et al., 2008, modified).
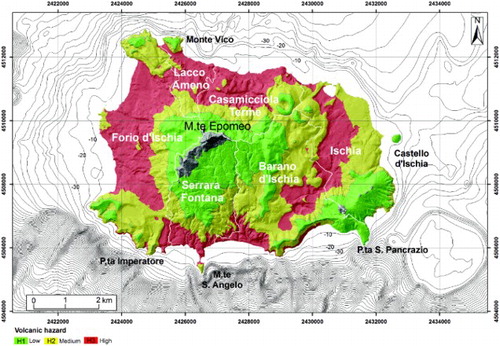
Figure 3. Urban development at Ischia Island from 1936 to 2004.
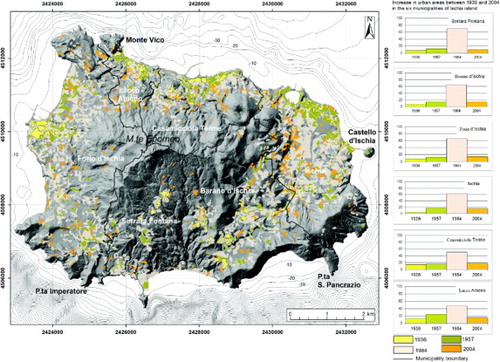
Figure 4. Rate of increase of urban area extent in the single municipalities (a) and in the entire Ischia Island (b) from 1936 to 2004. Municipality labels: B=Barano d'Ischia, C=Casamicciola Terme, F=Forio d'Ischia, I= Ischia, L=Lacco Ameno, S= Serrara Fontana.
Table 1. Extent in square kilometers of the urbanized areas in 1936, 1957, 1984 and 2004 for the six municipalities of Ischia Island.
Figure 5. Population trend in the six municipalities of Ischia Island from 1951 to 2010.
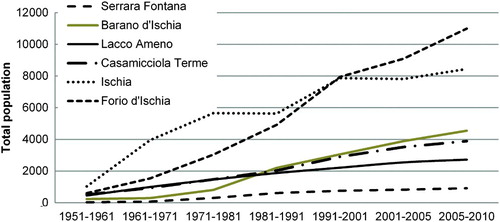
Figure 6. Rate of total population growth in the six municipalities of Ischia Island from 1951 to 2010.
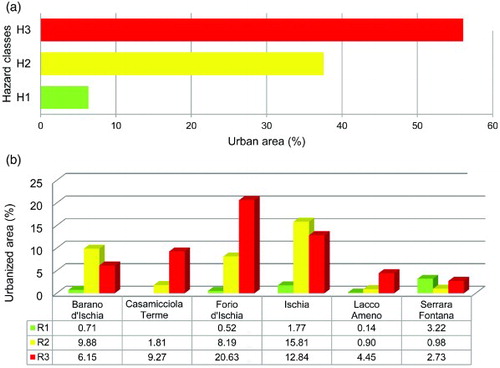
Figure 7. Percentage of urban extent in different hazard areas for the whole island territory (a) and for the single municipality (b) between 1936 and 2004.