
Figures & data
Figure 1. Map of the study area.
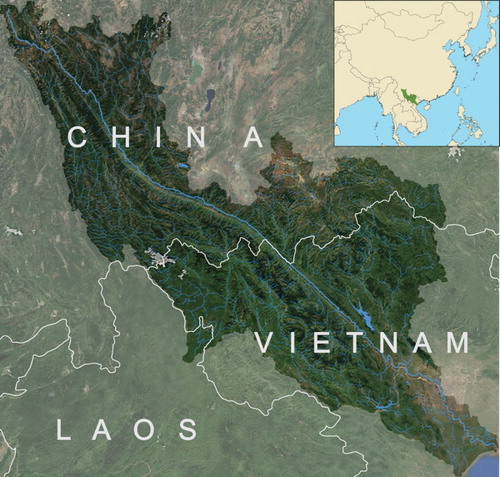
Table 1. Codes, types and interpretation keys of pollution sources.
Figure 2. Example of visual interpretation based on Google Earth.
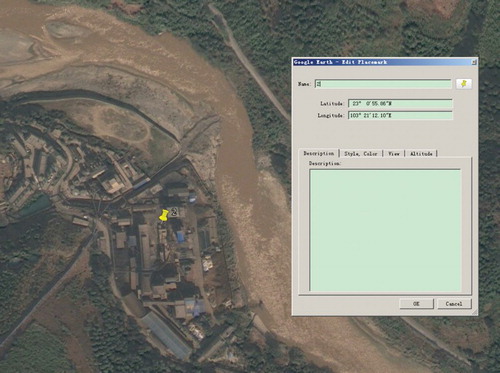
Table 2. Scoring system of pollution sources.
Figure 3. Spatial distributions of derived pollution sources from Google Earth.
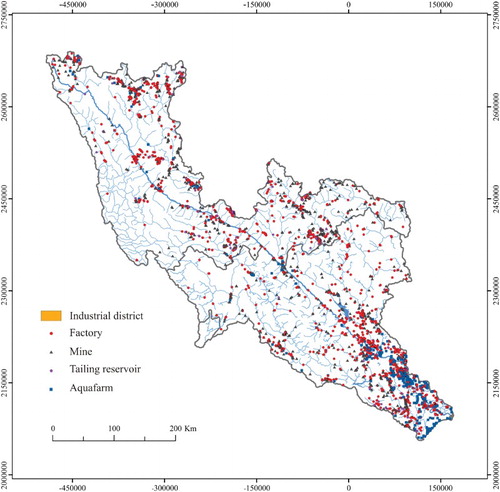
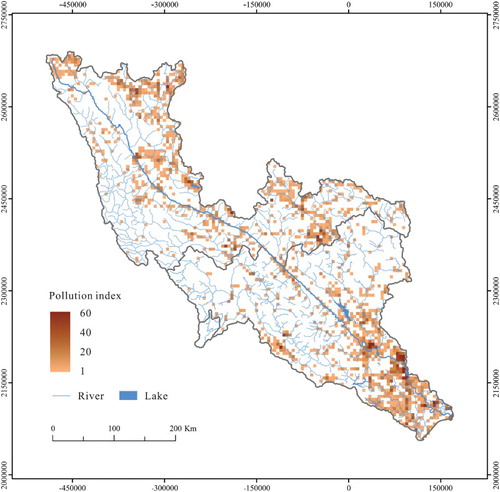
Figure 4. Pollution index map of Red River Valley.
Supplemental material