Figures & data
Figure 1. (a) Simplified geological map of the central Apennines showing the distribution of the main paleogeographic domains (modified and adapted from CitationBigi et al., 1990); (b) schematic relationship between palaeographic domains, lithological composition and permeability attitude. Note the width of boxes illustrating the permeability is expressed in chronostratigraphic terms and does not reflect the thickness of the lithological complexes. Stratigraphy of paleogeographic domains are obtained and adapted from CitationCarmignani et al. (1994), CitationJolivet et al. (1998), CitationBrogi and Fabbrini (2009), CitationMastrorillo and Petitta (2010).
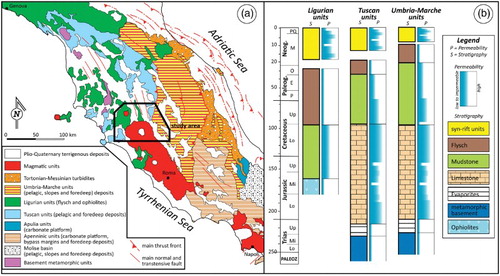
Figure 2. Examples of available geological cartography for three different administrative regions, showing heterogeneous mapping criteria. CTR: Regional technical cartography. The extracted frames are from: CitationRegione Toscana (2006; http://www.regione.toscana.it), for Tuscany region; CitationRegione Umbria (1999; http://www.territorio.regione.umbria.it/), for Umbria region; CitationCosentino and Pasquali (2012), for Latium.
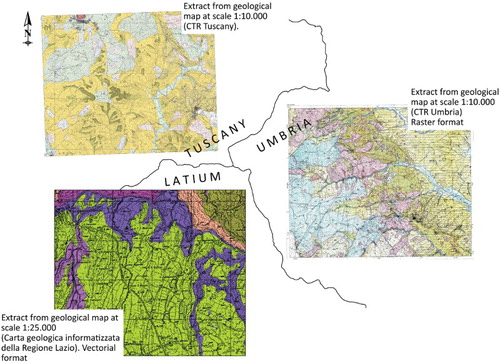
Figure 3. Flow chart illustrating the methodology adopted for hydrolithological complex mapping in the study area.
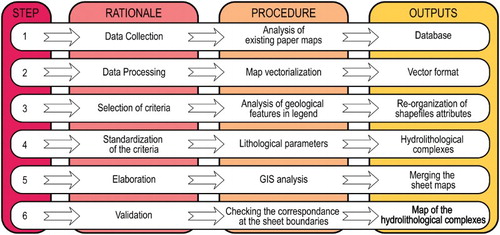
Figure 4. Hierarchical classification used for the redistribution of the geological units. The qualitative permeability attributed are also shown.
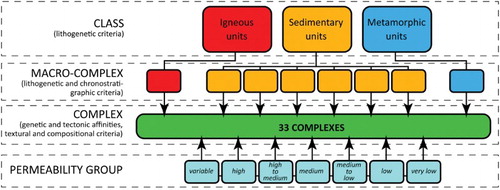
Table 1. The hydrolithological complexes obtained for the study area.
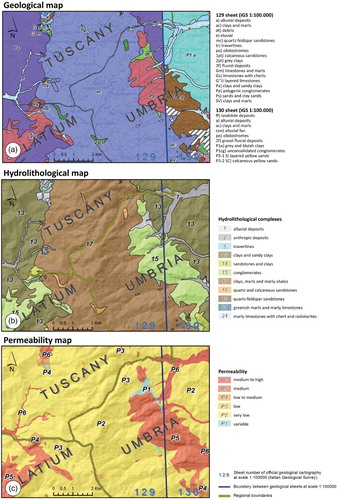
Figure 5. (a) An extract of the official geological cartography at a scale of 1:100,000 (Italian Geological Survey), including the administrative boundaries. Note the dissimilarity between legends of each sheet; (b) extract of the hydrolithological map of the study area and (c) the derivative permeability distribution map.